Fig. 4.
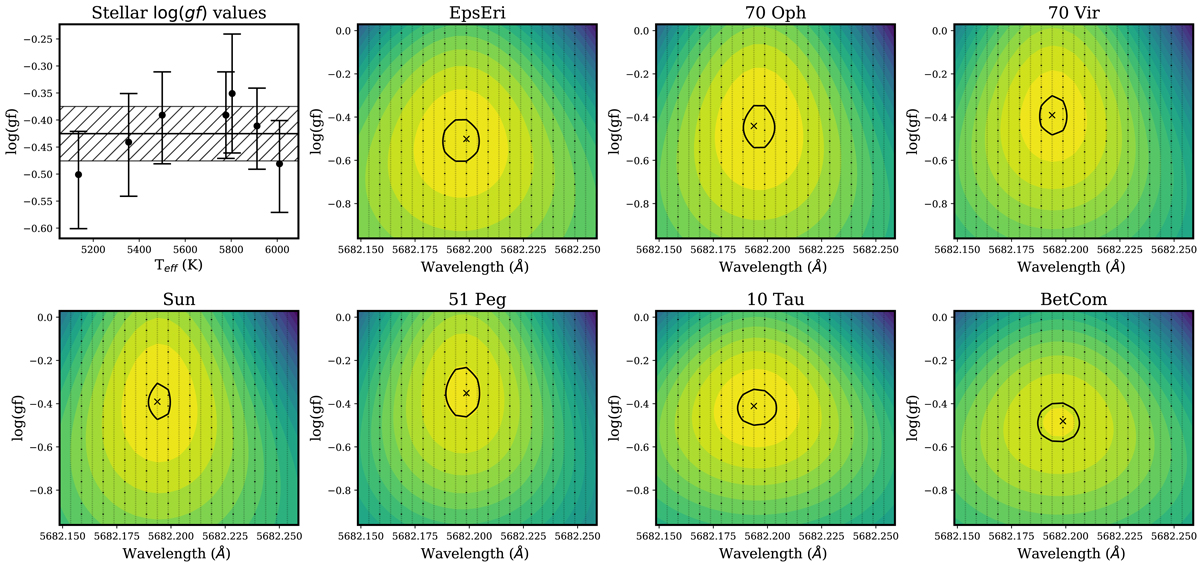
log(g f)grid values and ![]() distributions for the λ5682.2 Ni I line. Top left panel: individual log(g f)grid values per star, including 68.3% confidence-limit error bars, plotted against benchmark Teff. The solid black line denotes the weighted
distributions for the λ5682.2 Ni I line. Top left panel: individual log(g f)grid values per star, including 68.3% confidence-limit error bars, plotted against benchmark Teff. The solid black line denotes the weighted ![]() and the hatched region denotes the standard deviation estimation, discussed in Sect. 4.3.8. Remaining panels:
and the hatched region denotes the standard deviation estimation, discussed in Sect. 4.3.8. Remaining panels: ![]() distributions of the synthesised grid of λ and log(g f) values for the seven benchmark stars. Calculated grid points are denoted by black dots, the individual log(g f)grid values are denoted by black crosses, and the 68.3% confidence limits are shown with black contours. Each plot has a normalised
distributions of the synthesised grid of λ and log(g f) values for the seven benchmark stars. Calculated grid points are denoted by black dots, the individual log(g f)grid values are denoted by black crosses, and the 68.3% confidence limits are shown with black contours. Each plot has a normalised ![]() colour-scale, where yellow represents the
colour-scale, where yellow represents the ![]() minimum, and dark blue represents the
minimum, and dark blue represents the ![]() maximum.
maximum.
Current usage metrics show cumulative count of Article Views (full-text article views including HTML views, PDF and ePub downloads, according to the available data) and Abstracts Views on Vision4Press platform.
Data correspond to usage on the plateform after 2015. The current usage metrics is available 48-96 hours after online publication and is updated daily on week days.
Initial download of the metrics may take a while.