Fig. C.3.
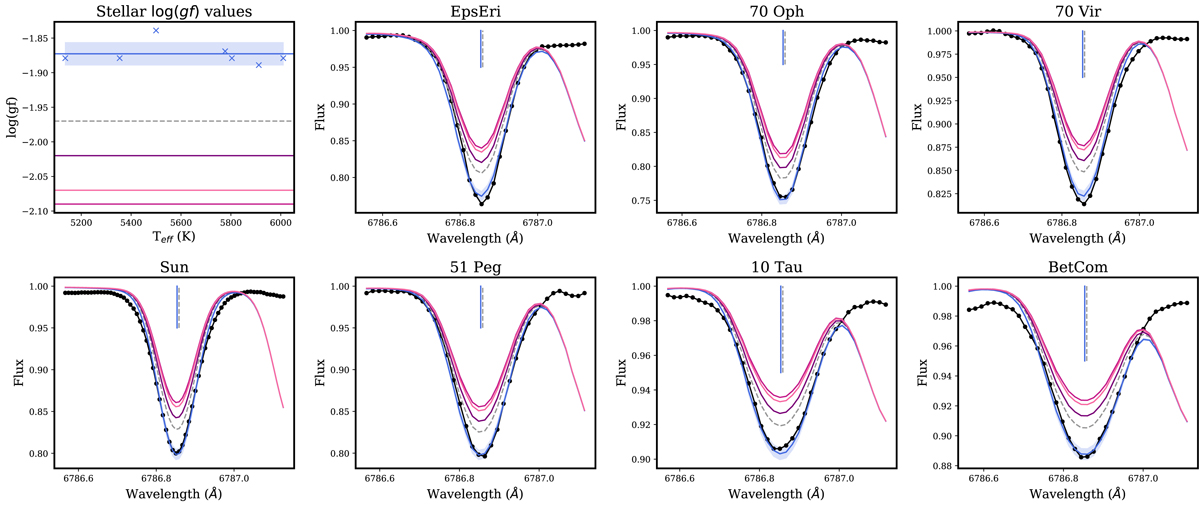
Quality assessment for the λ6786.8 Fe I line. The style follows that of Figs. B.1–B.3, minus the ![]() line profiles, and with several additional line profiles corresponding to the available literature log(g f) values of the transition. In this case none of the literature log(g f) values can accurately reproduce the observed profile, with Δ log(g f) values ranging between 0.1–0.25 dex, thus we would propose our
line profiles, and with several additional line profiles corresponding to the available literature log(g f) values of the transition. In this case none of the literature log(g f) values can accurately reproduce the observed profile, with Δ log(g f) values ranging between 0.1–0.25 dex, thus we would propose our ![]() as a more accurate alternative.
as a more accurate alternative.
Current usage metrics show cumulative count of Article Views (full-text article views including HTML views, PDF and ePub downloads, according to the available data) and Abstracts Views on Vision4Press platform.
Data correspond to usage on the plateform after 2015. The current usage metrics is available 48-96 hours after online publication and is updated daily on week days.
Initial download of the metrics may take a while.