Fig. 2.
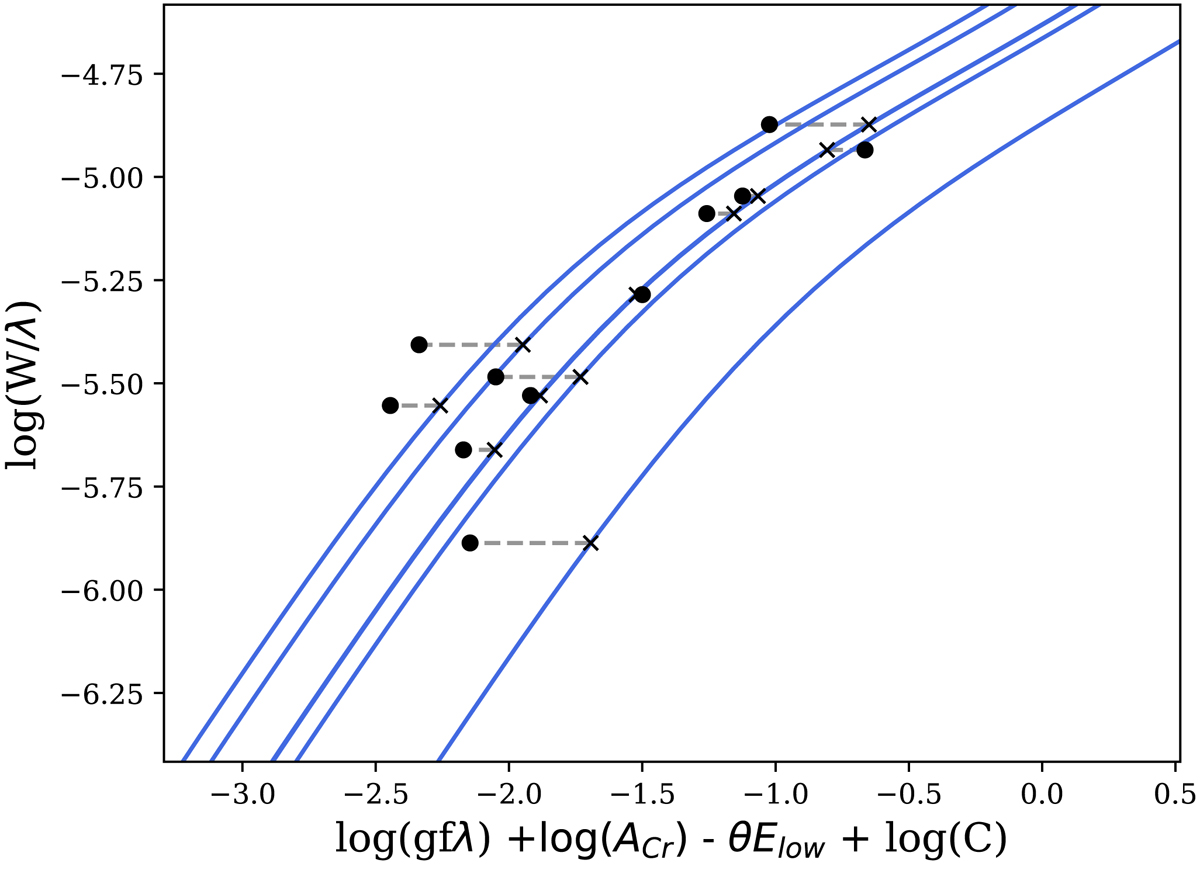
Conversion of observed Cr II line equivalent width values into log(g f) values using theoretical curves of growth for a given star. Blue lines represent theoretical curves of growth for different Cr II lines. Black circles are measured equivalent width values plotted using the log(g f)input values, while black crosses are measured equivalent width values plotted using derived log(g f) values, i.e. the intersect of the equivalent width value with its respective curve of growth.
Current usage metrics show cumulative count of Article Views (full-text article views including HTML views, PDF and ePub downloads, according to the available data) and Abstracts Views on Vision4Press platform.
Data correspond to usage on the plateform after 2015. The current usage metrics is available 48-96 hours after online publication and is updated daily on week days.
Initial download of the metrics may take a while.