Fig. B.3.
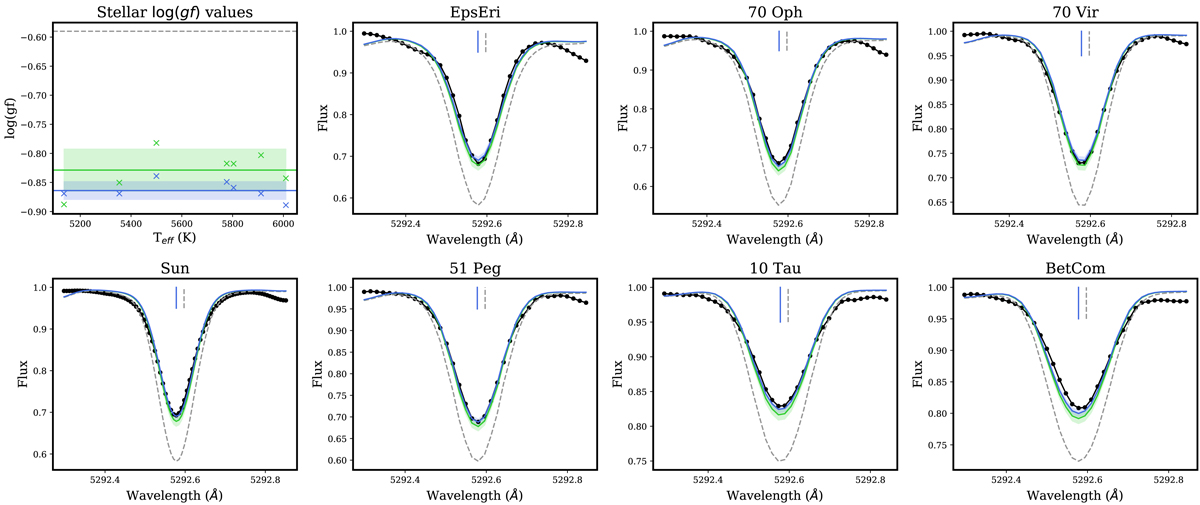
log(g f) determinations for the λ5292.6 Fe I line deemed suitable for quality assessment and deemed to be robust against adopted analysis method. Observed line profiles are shown in black dots, line profiles calculated using the log(g f)input values are shown in dashed grey, line profiles calculated using the ![]() values are shown in green, line profiles calculated using the
values are shown in green, line profiles calculated using the ![]() values are shown in blue, and errors are shown as green and blue shaded areas, respectively. Vertical blue and dashed grey lines denote the
values are shown in blue, and errors are shown as green and blue shaded areas, respectively. Vertical blue and dashed grey lines denote the ![]() and λinput values, respectively. This line also shows a measurable Δλ correction of ∼0.02 Å to the input wavelength.
and λinput values, respectively. This line also shows a measurable Δλ correction of ∼0.02 Å to the input wavelength.
Current usage metrics show cumulative count of Article Views (full-text article views including HTML views, PDF and ePub downloads, according to the available data) and Abstracts Views on Vision4Press platform.
Data correspond to usage on the plateform after 2015. The current usage metrics is available 48-96 hours after online publication and is updated daily on week days.
Initial download of the metrics may take a while.