Fig. 14.
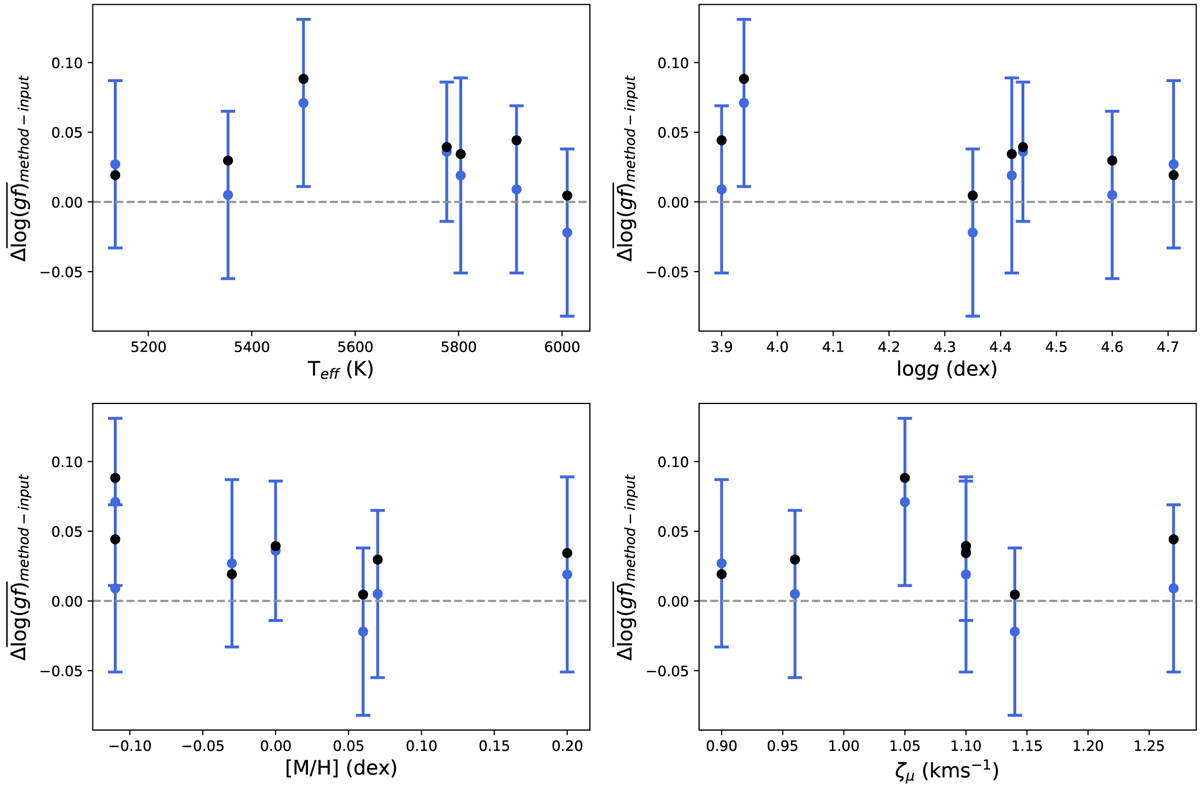
Median of the 408 analysis-independent ![]() values, for both the curve of growth (black circles) and iterative modelling (blue circles) methods, are plotted against the stellar parameters of the seven benchmark stars. The median of the σgrid values are denoted by the blue error bars. The overestimation of the
values, for both the curve of growth (black circles) and iterative modelling (blue circles) methods, are plotted against the stellar parameters of the seven benchmark stars. The median of the σgrid values are denoted by the blue error bars. The overestimation of the ![]() relative to the
relative to the ![]() values can be seen. Apart from V I, we do not find any clear trends with respect to the stellar parameters for any of the 14 remaining species in the analysis-independent subset of lines.
values can be seen. Apart from V I, we do not find any clear trends with respect to the stellar parameters for any of the 14 remaining species in the analysis-independent subset of lines.
Current usage metrics show cumulative count of Article Views (full-text article views including HTML views, PDF and ePub downloads, according to the available data) and Abstracts Views on Vision4Press platform.
Data correspond to usage on the plateform after 2015. The current usage metrics is available 48-96 hours after online publication and is updated daily on week days.
Initial download of the metrics may take a while.