Fig. 12.
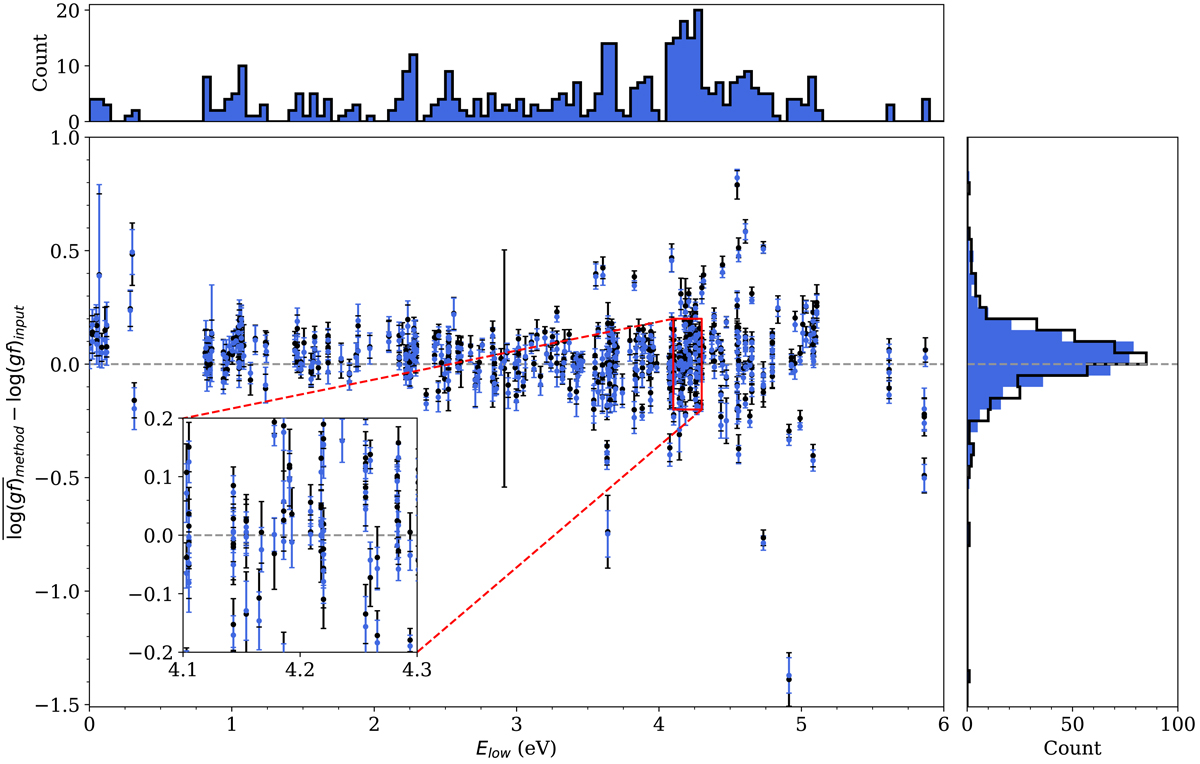
As in Fig. 10, but plotted as a function of Elow. There is a slight upward inflection of ![]() values at excitation energies of Elow ≤ 0.25 eV which is possibly a symptom of non-LTE effects in these low-level transitions. Between 3.5 ≤ Elow ≤ 5.0 eV we find an increase in scatter of
values at excitation energies of Elow ≤ 0.25 eV which is possibly a symptom of non-LTE effects in these low-level transitions. Between 3.5 ≤ Elow ≤ 5.0 eV we find an increase in scatter of ![]() values, often belonging to higher excitation Fe I transitions. The zoomed subplot shows that a significant number of analysis-independent transitions have multiplets in common, and that the log(g f) values of these multiplets can show significant scatter.
values, often belonging to higher excitation Fe I transitions. The zoomed subplot shows that a significant number of analysis-independent transitions have multiplets in common, and that the log(g f) values of these multiplets can show significant scatter.
Current usage metrics show cumulative count of Article Views (full-text article views including HTML views, PDF and ePub downloads, according to the available data) and Abstracts Views on Vision4Press platform.
Data correspond to usage on the plateform after 2015. The current usage metrics is available 48-96 hours after online publication and is updated daily on week days.
Initial download of the metrics may take a while.