Fig. 11.
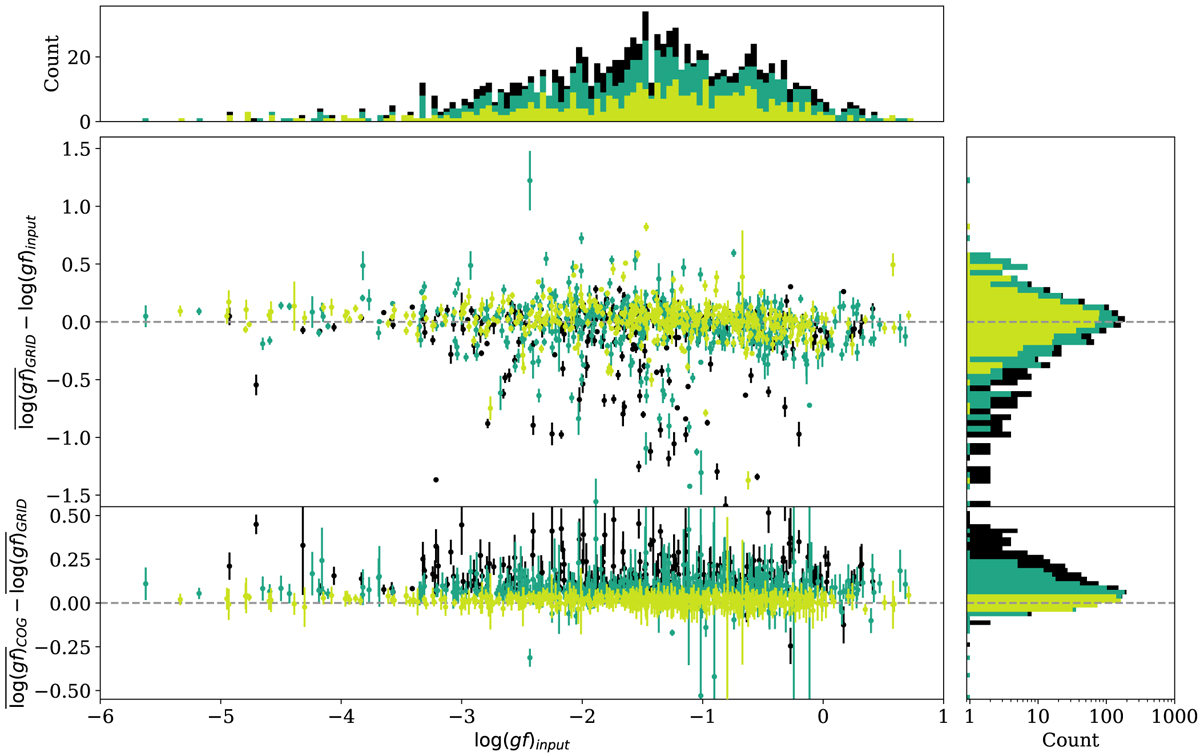
![]() vs. log(g f)input for the 1091 investigated lines. Bottom panel: as above but for
vs. log(g f)input for the 1091 investigated lines. Bottom panel: as above but for ![]() . The 408 analysis-independent lines are shown in light green, the remainder of the 845 quality-assessable lines are shown in dark green, and the remainder of the 1091 investigated lines are shown in black. There are no obvious trends in either
. The 408 analysis-independent lines are shown in light green, the remainder of the 845 quality-assessable lines are shown in dark green, and the remainder of the 1091 investigated lines are shown in black. There are no obvious trends in either ![]() or
or ![]() with respect to log(g f)input, except for a number of transitions where both methods, agreeing with each other within errors, find significant upward revisions of the log(g f)input values as large as Δ log(g f) = 1.5 dex.
with respect to log(g f)input, except for a number of transitions where both methods, agreeing with each other within errors, find significant upward revisions of the log(g f)input values as large as Δ log(g f) = 1.5 dex.
Current usage metrics show cumulative count of Article Views (full-text article views including HTML views, PDF and ePub downloads, according to the available data) and Abstracts Views on Vision4Press platform.
Data correspond to usage on the plateform after 2015. The current usage metrics is available 48-96 hours after online publication and is updated daily on week days.
Initial download of the metrics may take a while.