Free Access
Fig. 6.
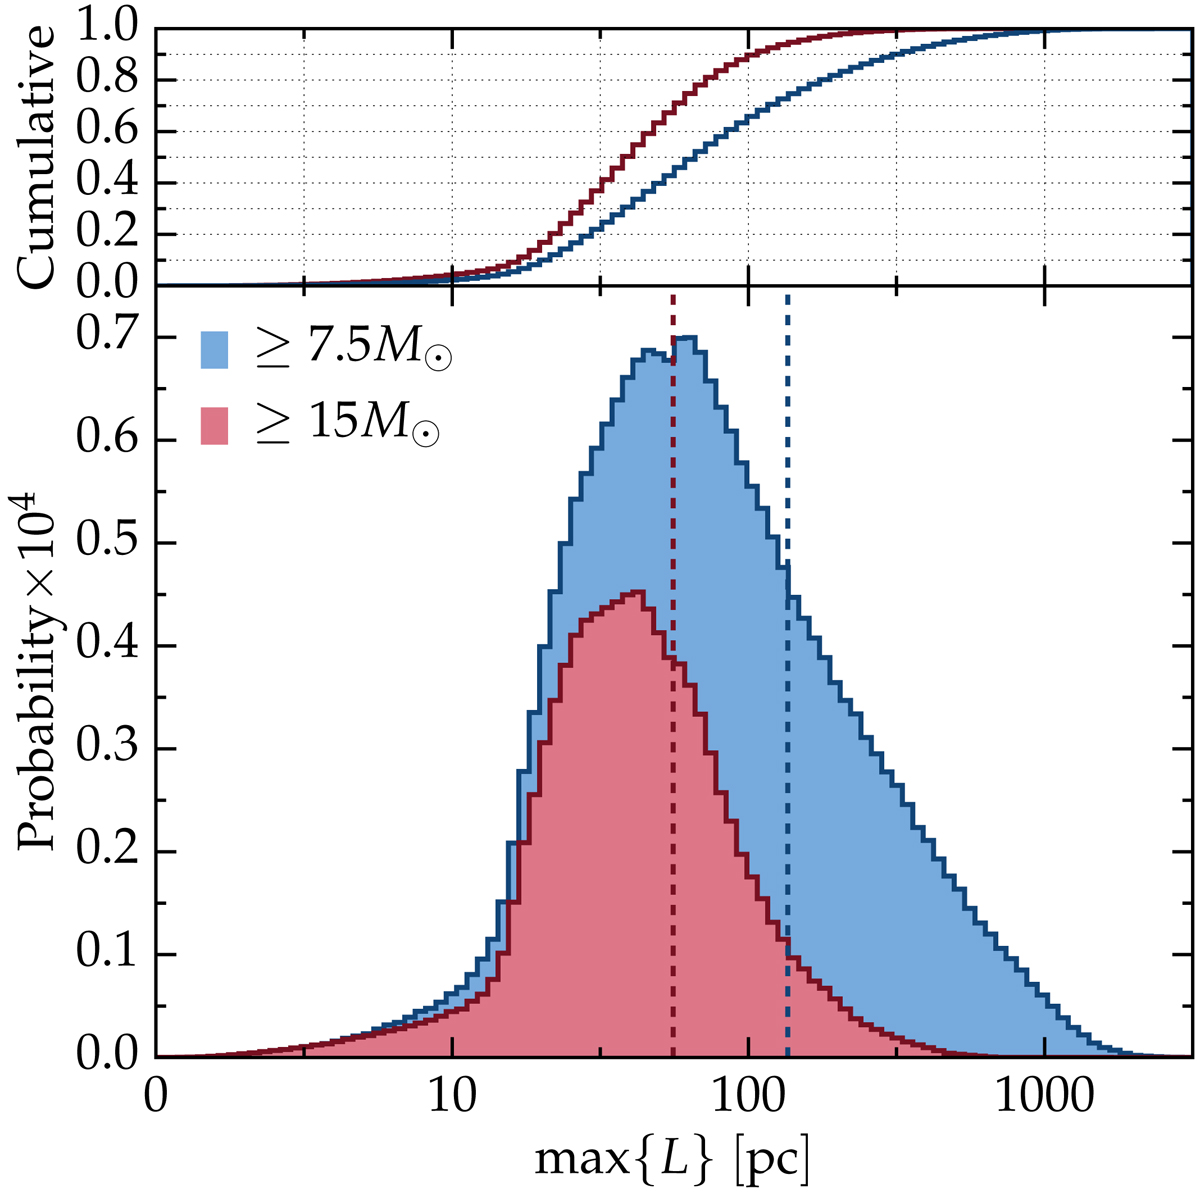
Distribution of the maximum distance L that ejected MS secondaries can reach, neglecting any gravitational potential. The blue and red histograms are for ejected stars more massive than 7.5 M⊙ and 15 M⊙, respectively. The vertical dashed lines mark the mean values of the distributions.
Current usage metrics show cumulative count of Article Views (full-text article views including HTML views, PDF and ePub downloads, according to the available data) and Abstracts Views on Vision4Press platform.
Data correspond to usage on the plateform after 2015. The current usage metrics is available 48-96 hours after online publication and is updated daily on week days.
Initial download of the metrics may take a while.