Fig. 5.
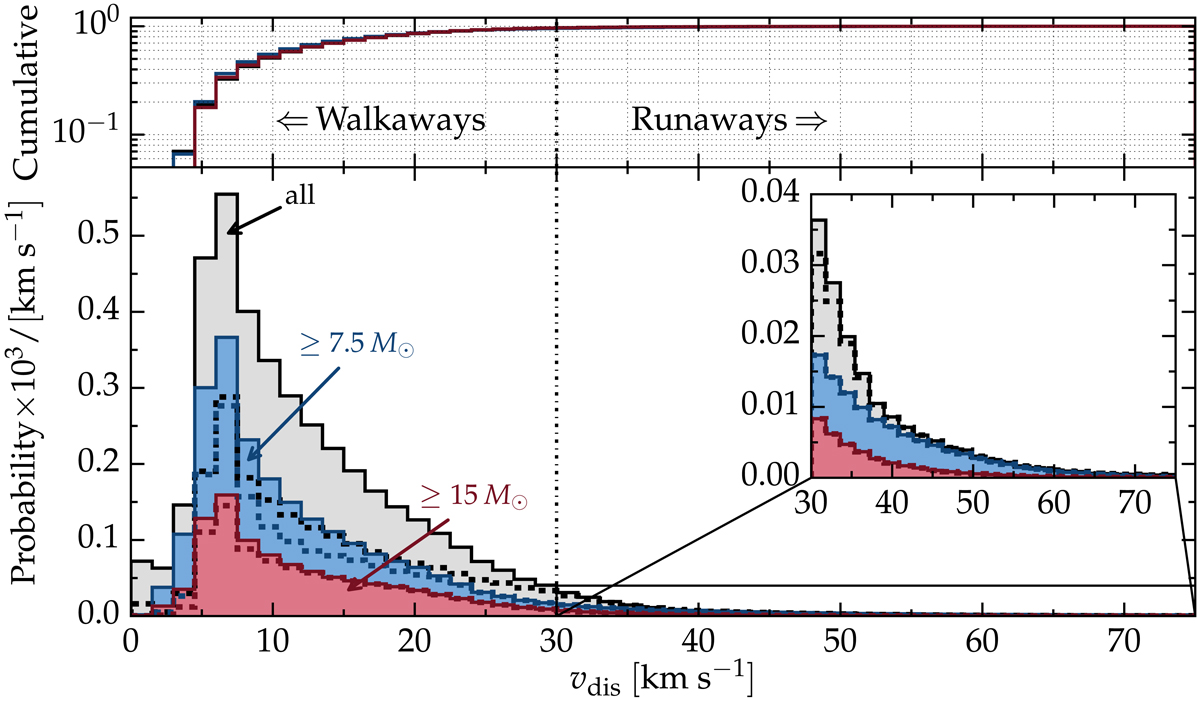
Velocity distribution of MS stars ejected from a binary system at the time of the first CC. Top panel: corresponding cumulative distributions. The walkaways are one order of magnitude more numerous than the runaways. The gray, blue, and red histograms show all MS secondaries, only MS stars more massive than 7.5 M⊙ (i.e., roughly those that might experience CC), and only MS stars more massive than 15 M⊙ (i.e., roughly the O-type stars), respectively. The mass considered here is taken right after the CC of the primary star. The dashed lines show the distribution of walkaways and runaways that have gone through RLOF (or common envelope evolution) before being ejected. Almost all massive runaways and walkaways, and the majority of the ejected stars at large velocities, have gone through RLOF. The inset plot magnifies the runaway regime vdis ≥ 30 km s−1. See also Fig. C.2 for a wider velocity range, Fig. C.1 for a figure accounting for the remaining lifetime as walkaway or runaway star, and Fig. 12 for an example of how the velocity dispersion of a star forming region affects these distributions.
Current usage metrics show cumulative count of Article Views (full-text article views including HTML views, PDF and ePub downloads, according to the available data) and Abstracts Views on Vision4Press platform.
Data correspond to usage on the plateform after 2015. The current usage metrics is available 48-96 hours after online publication and is updated daily on week days.
Initial download of the metrics may take a while.