Fig. 12.
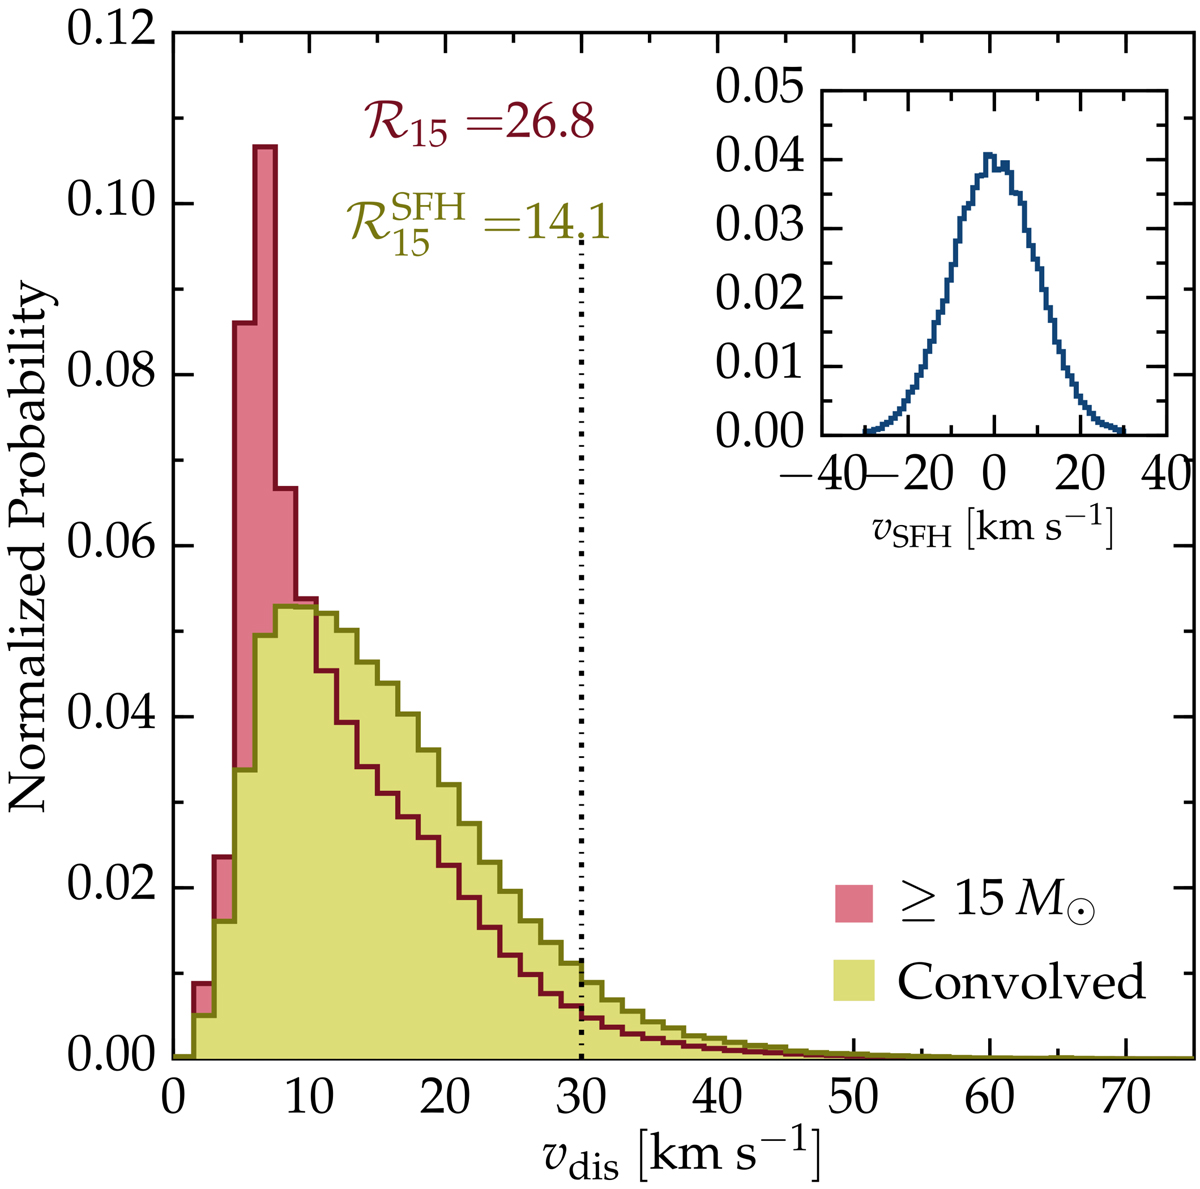
The yellow histogram shows the convolution of the distribution of ejected MS stars more massive than 15 M⊙ (red histogram, cf. Fig. 5) with a Gaussian with full-width-half-maximum of 10 km s−1 representing (an upper limit to) the velocity dispersion of a star forming region (shown in the inset plot). In this figure, the red histogram is normalized so that its surface area is one.
Current usage metrics show cumulative count of Article Views (full-text article views including HTML views, PDF and ePub downloads, according to the available data) and Abstracts Views on Vision4Press platform.
Data correspond to usage on the plateform after 2015. The current usage metrics is available 48-96 hours after online publication and is updated daily on week days.
Initial download of the metrics may take a while.