Fig. 9.
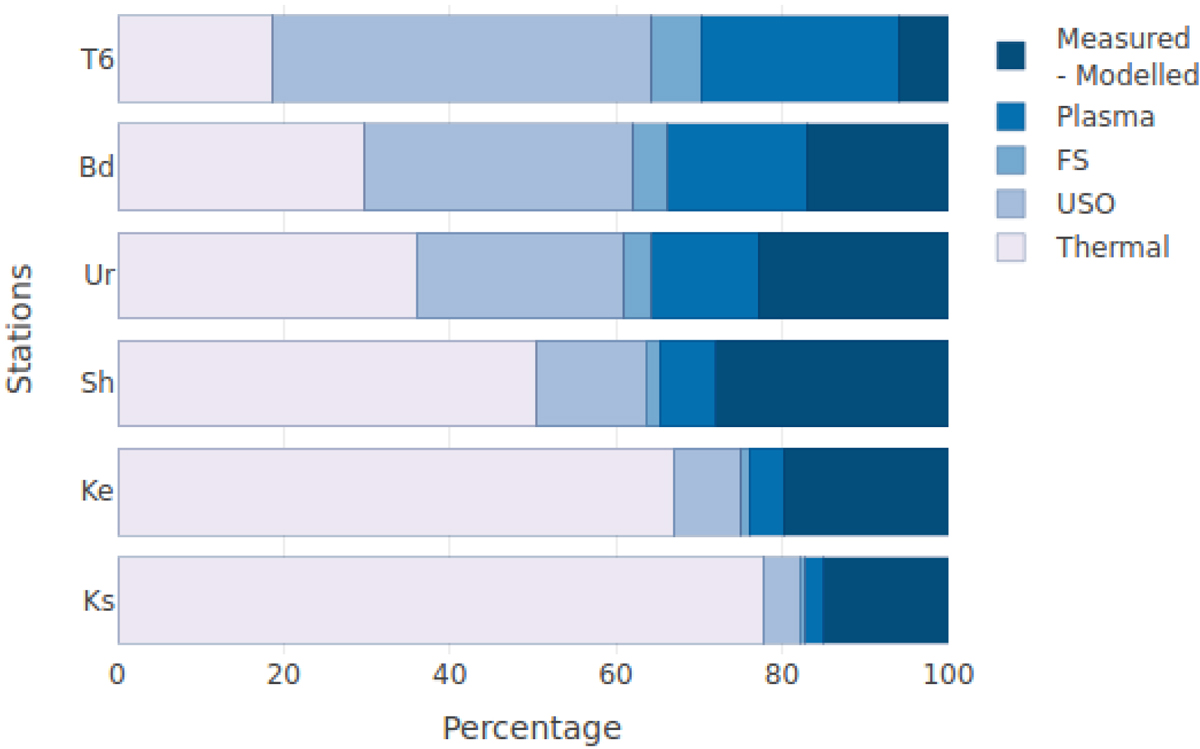
Percentage of the modeled noise sources in the total measured frequency residuals. In the case of T6 the predominant noise comes from the USO. For Bd, both the thermal noise and the USO noise represent each 30% of the total frequency residuals measured. Although Ur and Sh have the same antenna size the thermal noise of Sh is higher than that of Ur. The modeled thermal noise of Ke corresponds to almost 70% of the budget, which in comparison to other stations is reasonable since its antenna diameter is only 12 m and the station has an uncooled receiver. On the other hand, in the case of the 34 m Ks, the thermal noise corresponds to 80% of the budget which given its size indicates an under-performance of the station during the observations it was involved in. In the overall budget, the noise introduced by the frequency standard is considered to be marginal with respect to the other sources of noise.
Current usage metrics show cumulative count of Article Views (full-text article views including HTML views, PDF and ePub downloads, according to the available data) and Abstracts Views on Vision4Press platform.
Data correspond to usage on the plateform after 2015. The current usage metrics is available 48-96 hours after online publication and is updated daily on week days.
Initial download of the metrics may take a while.