Fig. 5.
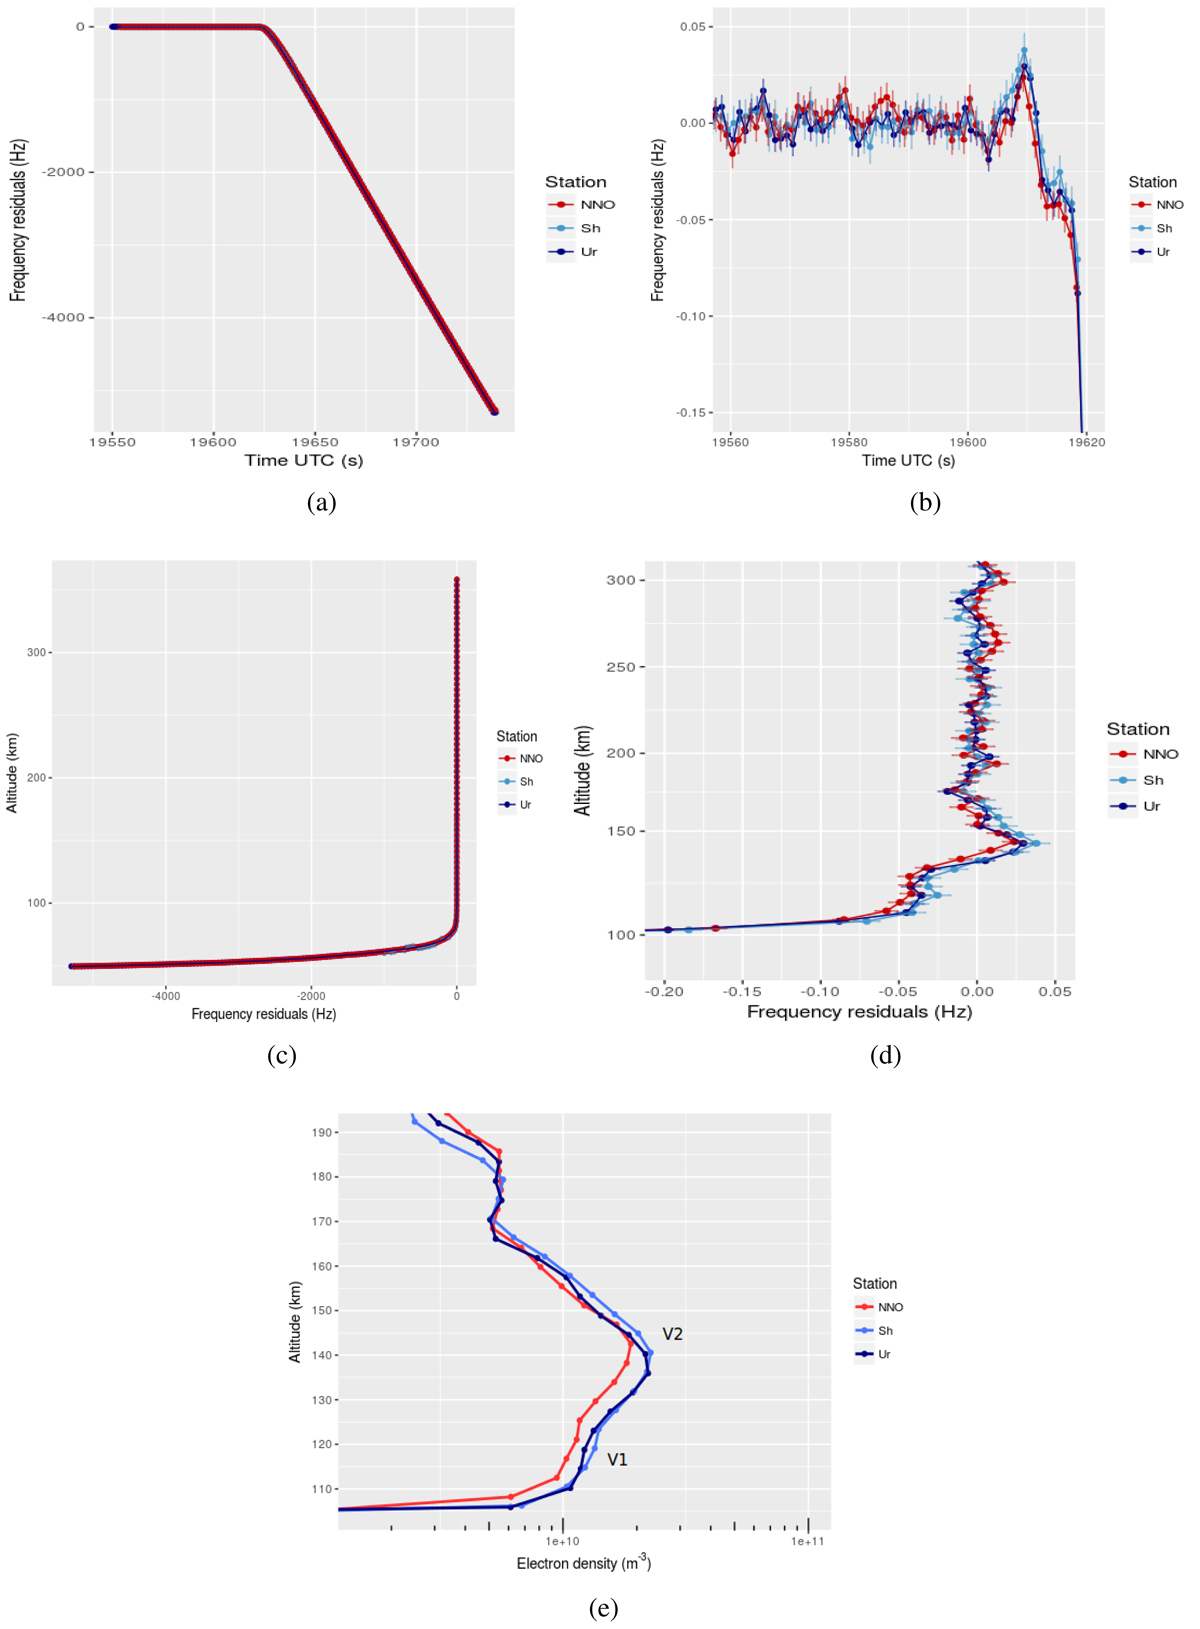
Frequency residuals retrieved from open-loop data from Ur and Sh compared to the residuals from closed-loop data from NNO, during occultation ingress in the session of 2012.04.27. Panel a: frequency residuals of the detected signal up to LOS. Panel b: zooms in the frequency residuals showing when the signal starts getting refracted by Venus’ ionosphere at around 19605 s. Panels c and d: corresponding altitude probed versus the frequency residuals of the data shown in panels a and b, respectively. Panel e: corresponding electron density profile, where the secondary V1 layer and main V2 layer of Venus’ ionosphere are identified.
Current usage metrics show cumulative count of Article Views (full-text article views including HTML views, PDF and ePub downloads, according to the available data) and Abstracts Views on Vision4Press platform.
Data correspond to usage on the plateform after 2015. The current usage metrics is available 48-96 hours after online publication and is updated daily on week days.
Initial download of the metrics may take a while.