Fig. 16.
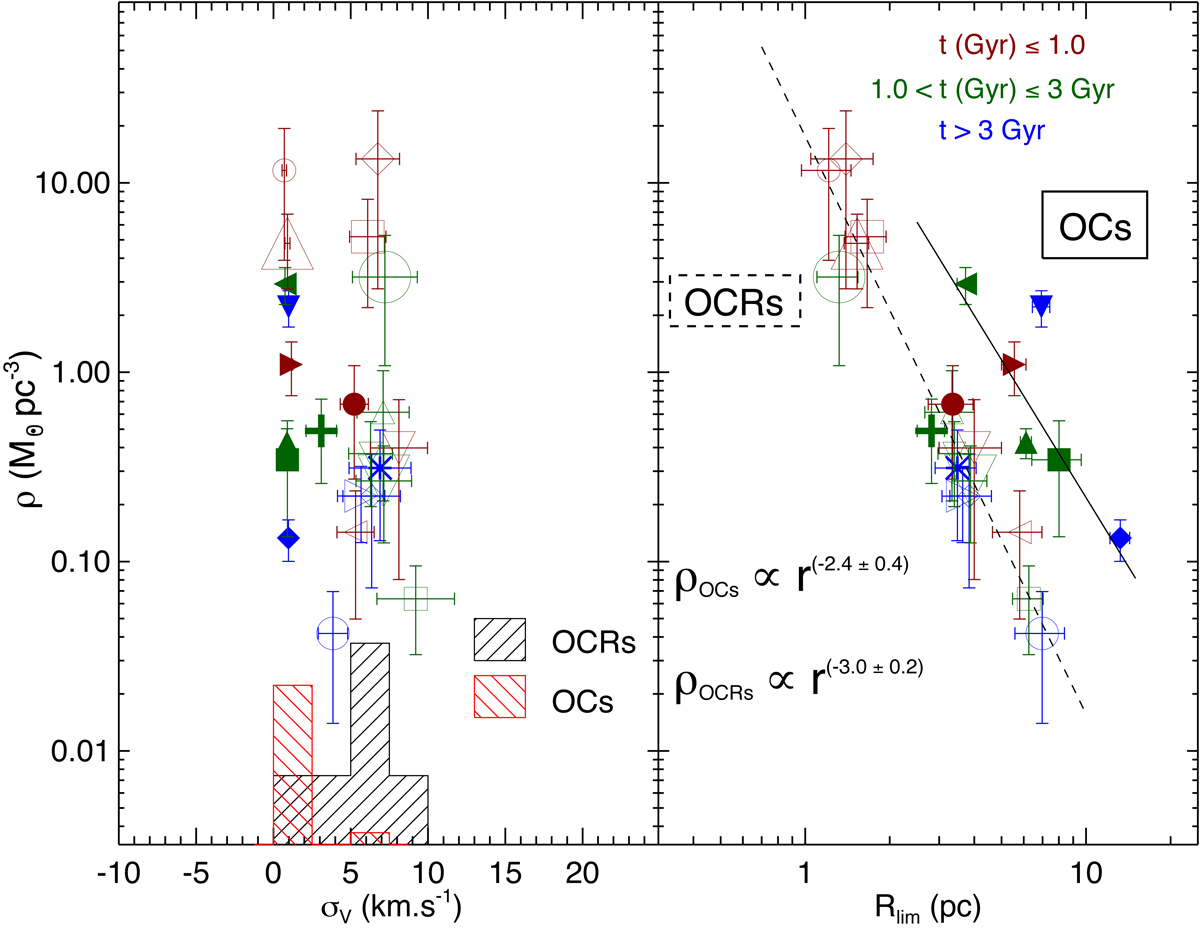
Left panel: mean stellar densities as function of the velocity dispersions σv for the 23 OCs and OCRs in our sample. Symbols are the same as those in Figs. 13 and 14. A normalized 3D velocity dispersion distribution of OCs (red) and OCRs (black) is represented by the hatched histogram. Right panel: mean stellar densities as a function of the limiting radii (Rlim). The dashed and continuous lines are linear fittings to the loci of points defined by the OCRs and OCs, respectively. Clusters were divided into three age bins, as indicated.
Current usage metrics show cumulative count of Article Views (full-text article views including HTML views, PDF and ePub downloads, according to the available data) and Abstracts Views on Vision4Press platform.
Data correspond to usage on the plateform after 2015. The current usage metrics is available 48-96 hours after online publication and is updated daily on week days.
Initial download of the metrics may take a while.