Fig. 4.
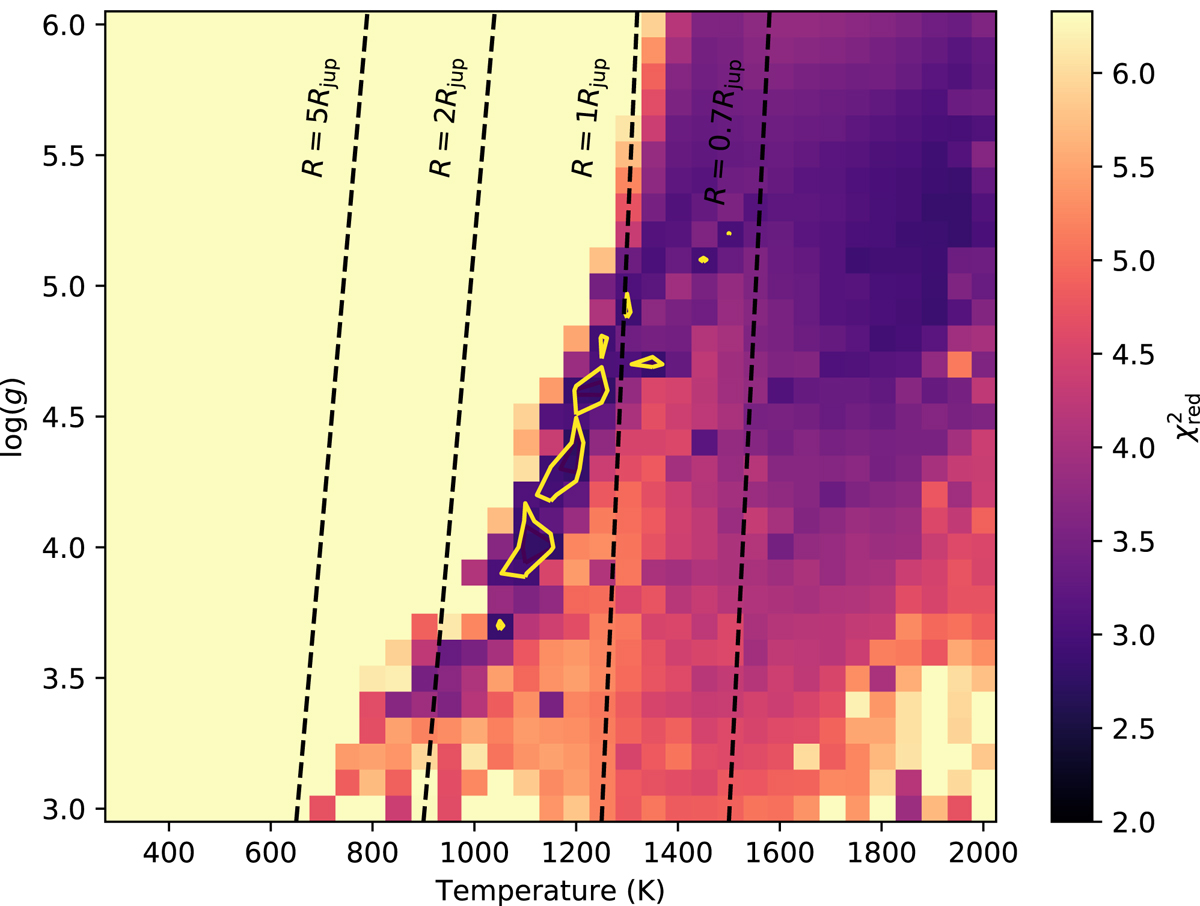
Reduced χ2 as a function of effective temperature and surface gravity from a grid of Exo-REM models (Charnay et al. 2018). The yellow contours correspond to the 5σ error, indicating a valley of possible temperatures between 1100 and 1200 K. The vertical lines correspond to the planet’s radius from the model K-band luminosity assuming a distance of 39.4 pc.
Current usage metrics show cumulative count of Article Views (full-text article views including HTML views, PDF and ePub downloads, according to the available data) and Abstracts Views on Vision4Press platform.
Data correspond to usage on the plateform after 2015. The current usage metrics is available 48-96 hours after online publication and is updated daily on week days.
Initial download of the metrics may take a while.