Fig. 3.
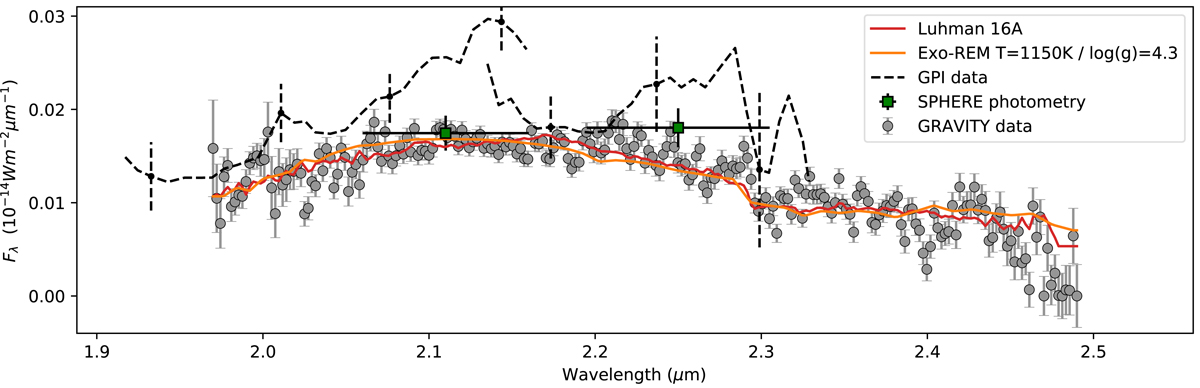
GRAVITY K band spectrum of HR8799 e at spectral resolution 500 (gray points). The red curve is the X-SHOOTER spectrum of the brown dwarf Luhman 16 A from Lodieu et al. (2015), smoothed to the GRAVITY resolution. The reduced ![]() is 2.4 (over 236° of freedom). The orange curve is the best fit of the Exo-REM models from Charnay et al. (2018). The reduced
is 2.4 (over 236° of freedom). The orange curve is the best fit of the Exo-REM models from Charnay et al. (2018). The reduced ![]() is 2.7. The dashed curve is the K-band GPI spectrum from Greenbaum et al. (2018). The square dots are the SPHERE photometry from Zurlo et al. (2016).
is 2.7. The dashed curve is the K-band GPI spectrum from Greenbaum et al. (2018). The square dots are the SPHERE photometry from Zurlo et al. (2016).
Current usage metrics show cumulative count of Article Views (full-text article views including HTML views, PDF and ePub downloads, according to the available data) and Abstracts Views on Vision4Press platform.
Data correspond to usage on the plateform after 2015. The current usage metrics is available 48-96 hours after online publication and is updated daily on week days.
Initial download of the metrics may take a while.