Fig. 7.
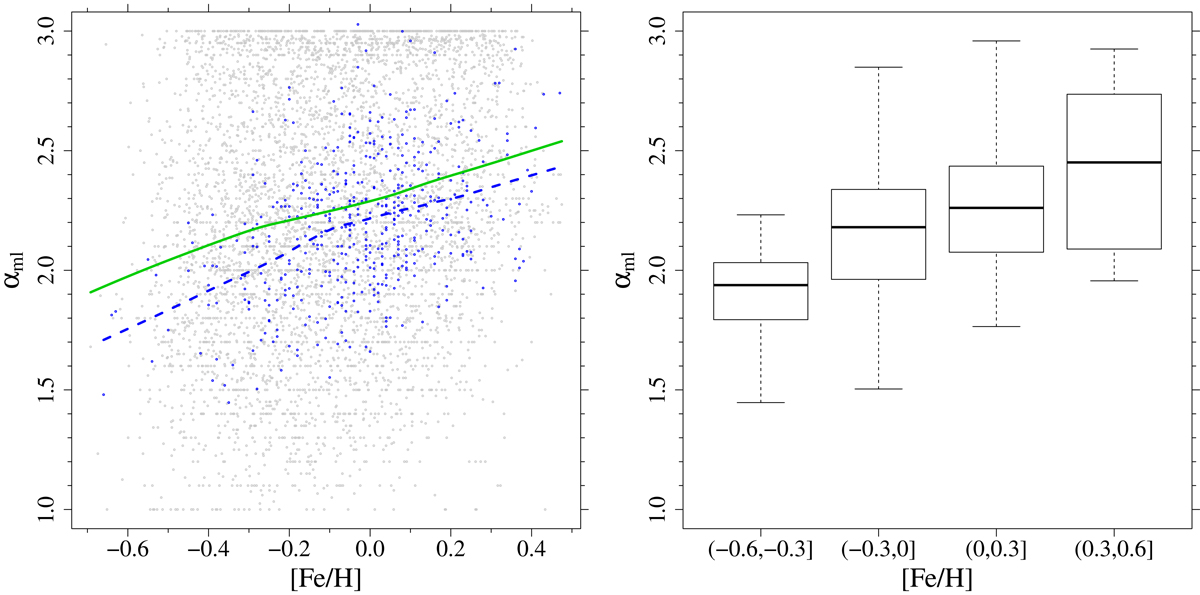
Left panel: comparison of the αml values obtained in the GS98 scenario (black dots) with those from Viani et al. (2018) (blue dots). The values from Viani et al. (2018) were offset by 0.4 to match the solar-scaled αml of the GS98 scenario. The green solid and blue dashed lines are the LOESS smoother for GS98 and Viani et al. (2018) datasets, respectively. Right panel: boxplot of the Viani et al. (2018) results in the metallicity bins adopted in the present work.
Current usage metrics show cumulative count of Article Views (full-text article views including HTML views, PDF and ePub downloads, according to the available data) and Abstracts Views on Vision4Press platform.
Data correspond to usage on the plateform after 2015. The current usage metrics is available 48-96 hours after online publication and is updated daily on week days.
Initial download of the metrics may take a while.