Fig. 3.
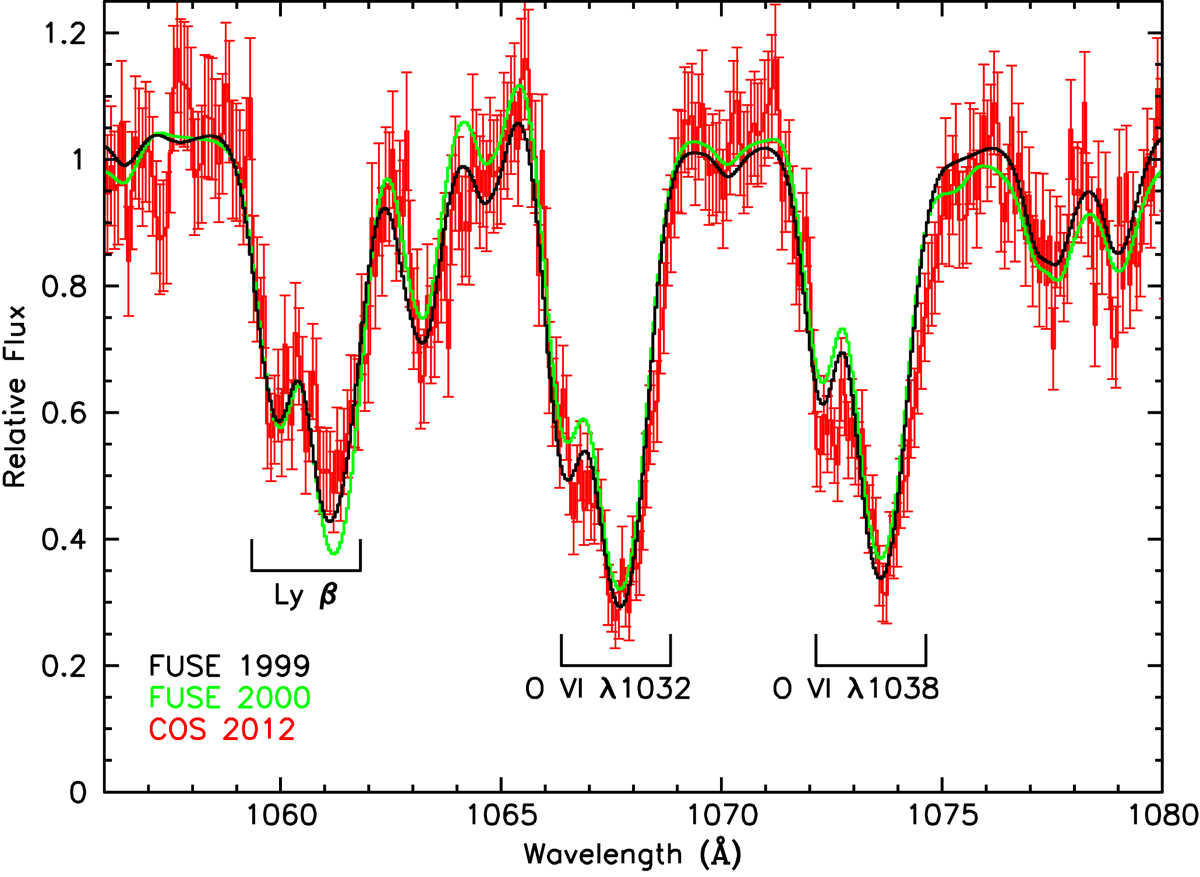
Normalized spectra comparing the intrinsic absorption features in Mrk 509 from the COS G140L spectrum obtained in 2012 (red) to FUSE spectra from 1999 (black) and 2000 (green). 1-σ error bars are attached to each COS spectral point. Relative fluxes are plotted as a function of observed wavelength. The Lyβ and O VI absorption troughs in Mrk 509 are labeled. Other dips in the spectra are foreground galactic interstellar absorption lines.
Current usage metrics show cumulative count of Article Views (full-text article views including HTML views, PDF and ePub downloads, according to the available data) and Abstracts Views on Vision4Press platform.
Data correspond to usage on the plateform after 2015. The current usage metrics is available 48-96 hours after online publication and is updated daily on week days.
Initial download of the metrics may take a while.