Fig. 2.
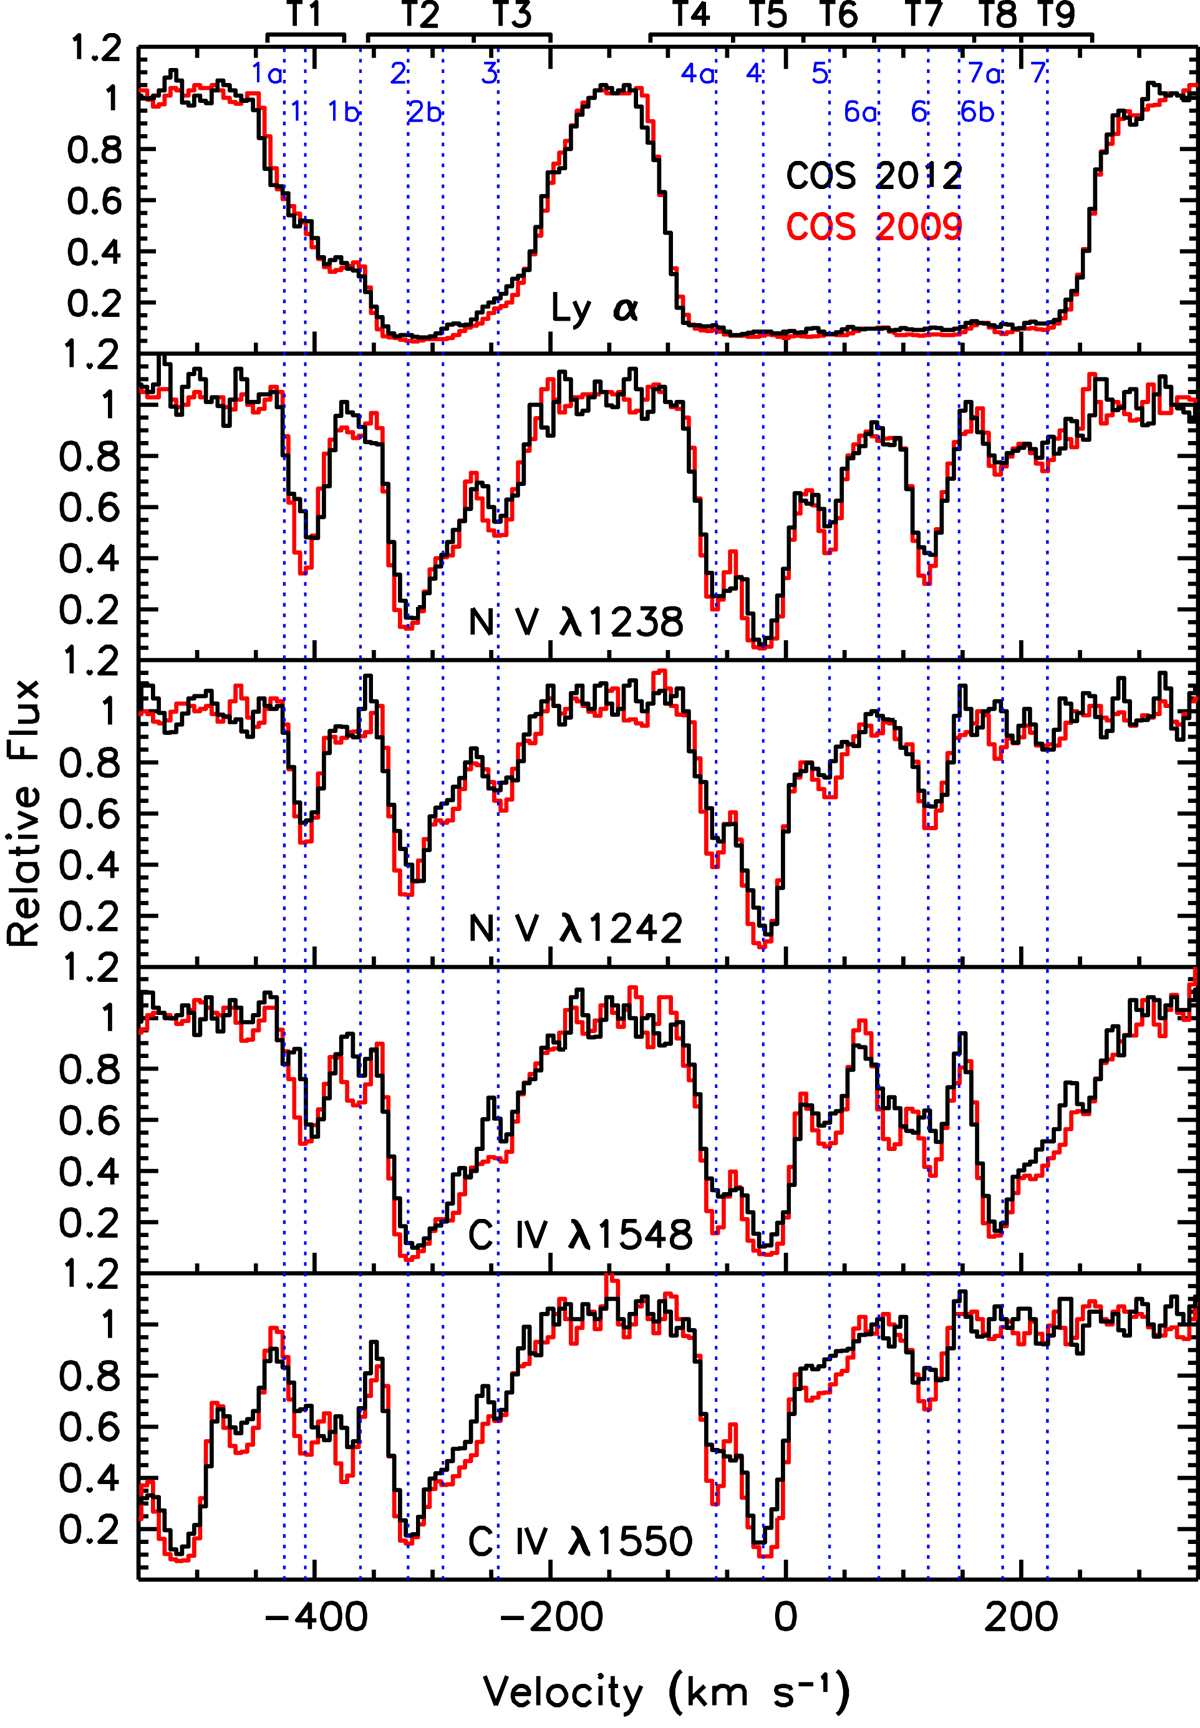
Normalized spectra comparing the intrinsic absorption features in Mrk 509 from COS spectra obtained in 2009 (red) and 2012 (black). Relative fluxes are plotted as a function of velocity relative to the host galaxy redshift of z = 0.034397 (Fisher et al. 1995). The blue dotted vertical lines are labeled with the components identified by Kriss et al. (2011). The boundaries of the selected spectral regions used to evaluate variability in the absorption troughs are indicated along the top horizontal axis (see also Table 3).
Current usage metrics show cumulative count of Article Views (full-text article views including HTML views, PDF and ePub downloads, according to the available data) and Abstracts Views on Vision4Press platform.
Data correspond to usage on the plateform after 2015. The current usage metrics is available 48-96 hours after online publication and is updated daily on week days.
Initial download of the metrics may take a while.