Fig. 1.
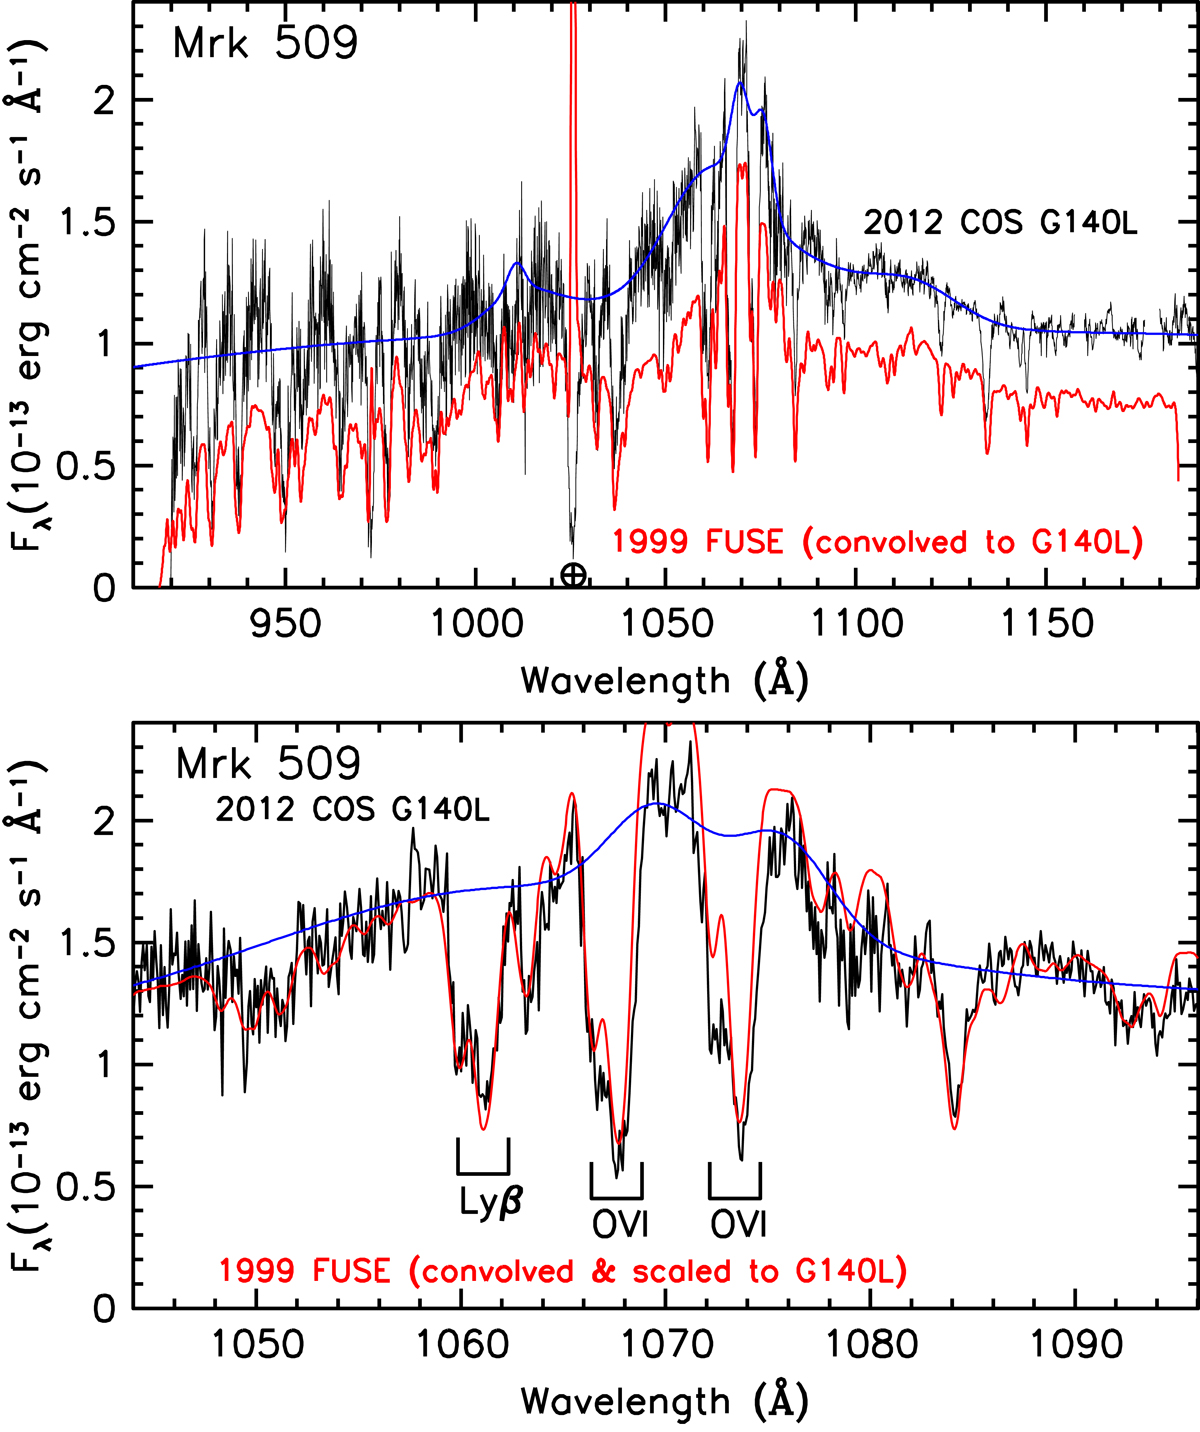
Top panel: calibrated and merged COS G140L spectrum of Mrk 509 from 2012 (black) compared to the 1999 FUSE spectrum of Kriss et al. (2000; red). The FUSE spectrum is convolved with the COS LSF to render it at the same spectral resolution. The best-fit emission model for the COS G140L is shown in blue. Geocoronal emission at Lyβ in the FUSE spectrum is indicated with an Earth symbol. Bottom panel: the 2012 COS spectrum, its best-fit emission model, and the 1999 FUSE spectrum are compared in greater detail in the region surrounding the O VI emission line. The FUSE spectrum was convolved to the COS resolution using the COS LSF, and scaled up to match the flux in the red and blue wings of the emission line. We note the higher peak in the emission line for the FUSE spectrum and the subtle differences in the relative strengths of the intrinsic absorption lines.
Current usage metrics show cumulative count of Article Views (full-text article views including HTML views, PDF and ePub downloads, according to the available data) and Abstracts Views on Vision4Press platform.
Data correspond to usage on the plateform after 2015. The current usage metrics is available 48-96 hours after online publication and is updated daily on week days.
Initial download of the metrics may take a while.