Fig. 5.
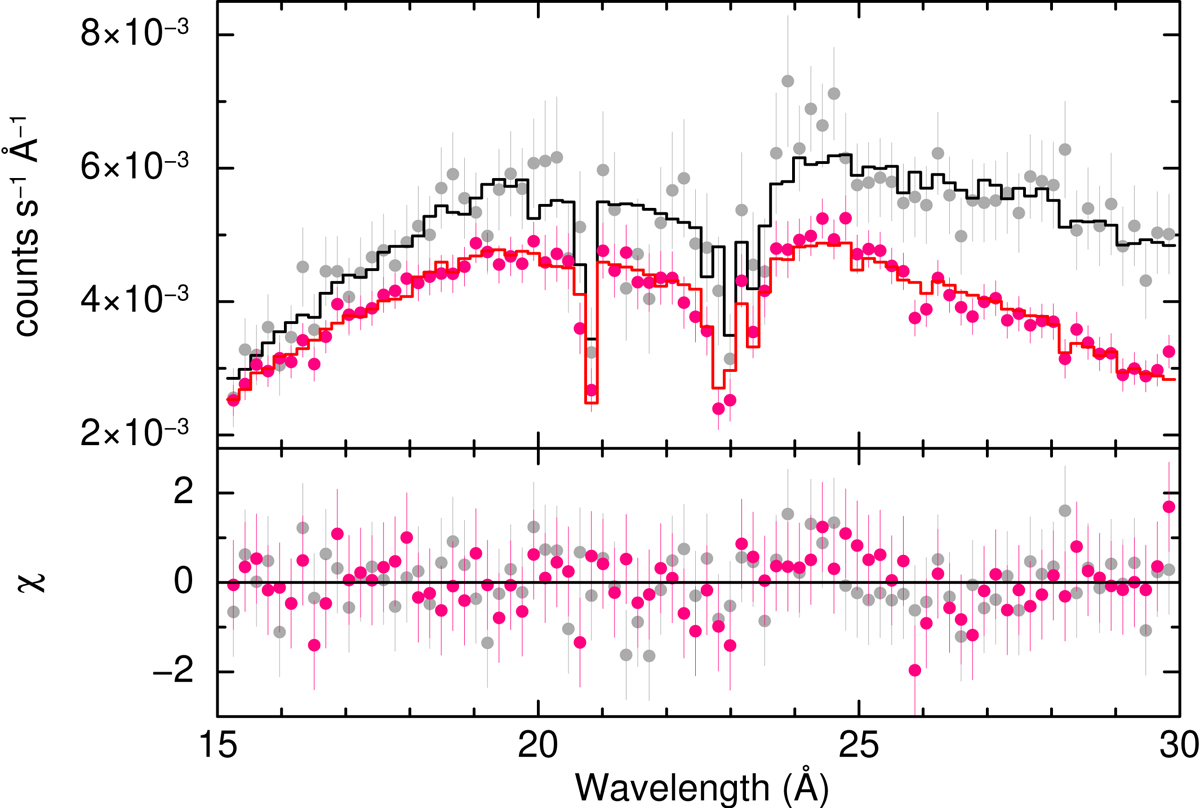
Results of RGS spectral fitting (see text and Table 8 for details). We show the stacked old and new RGS spectra (grey and magenta data points, respectively; the RGS1 and RGS2 spectra in each subgroup were co-added for plotting purposes). The model (solid black and red lines) fitted to the data in XSPEC is tbabs(bbody-gauss). The best-fit parameters differ in the two subgroups (see text). The two absorption lines at around λ = 20−23 Å are instrumental.
Current usage metrics show cumulative count of Article Views (full-text article views including HTML views, PDF and ePub downloads, according to the available data) and Abstracts Views on Vision4Press platform.
Data correspond to usage on the plateform after 2015. The current usage metrics is available 48-96 hours after online publication and is updated daily on week days.
Initial download of the metrics may take a while.