Fig. 4.
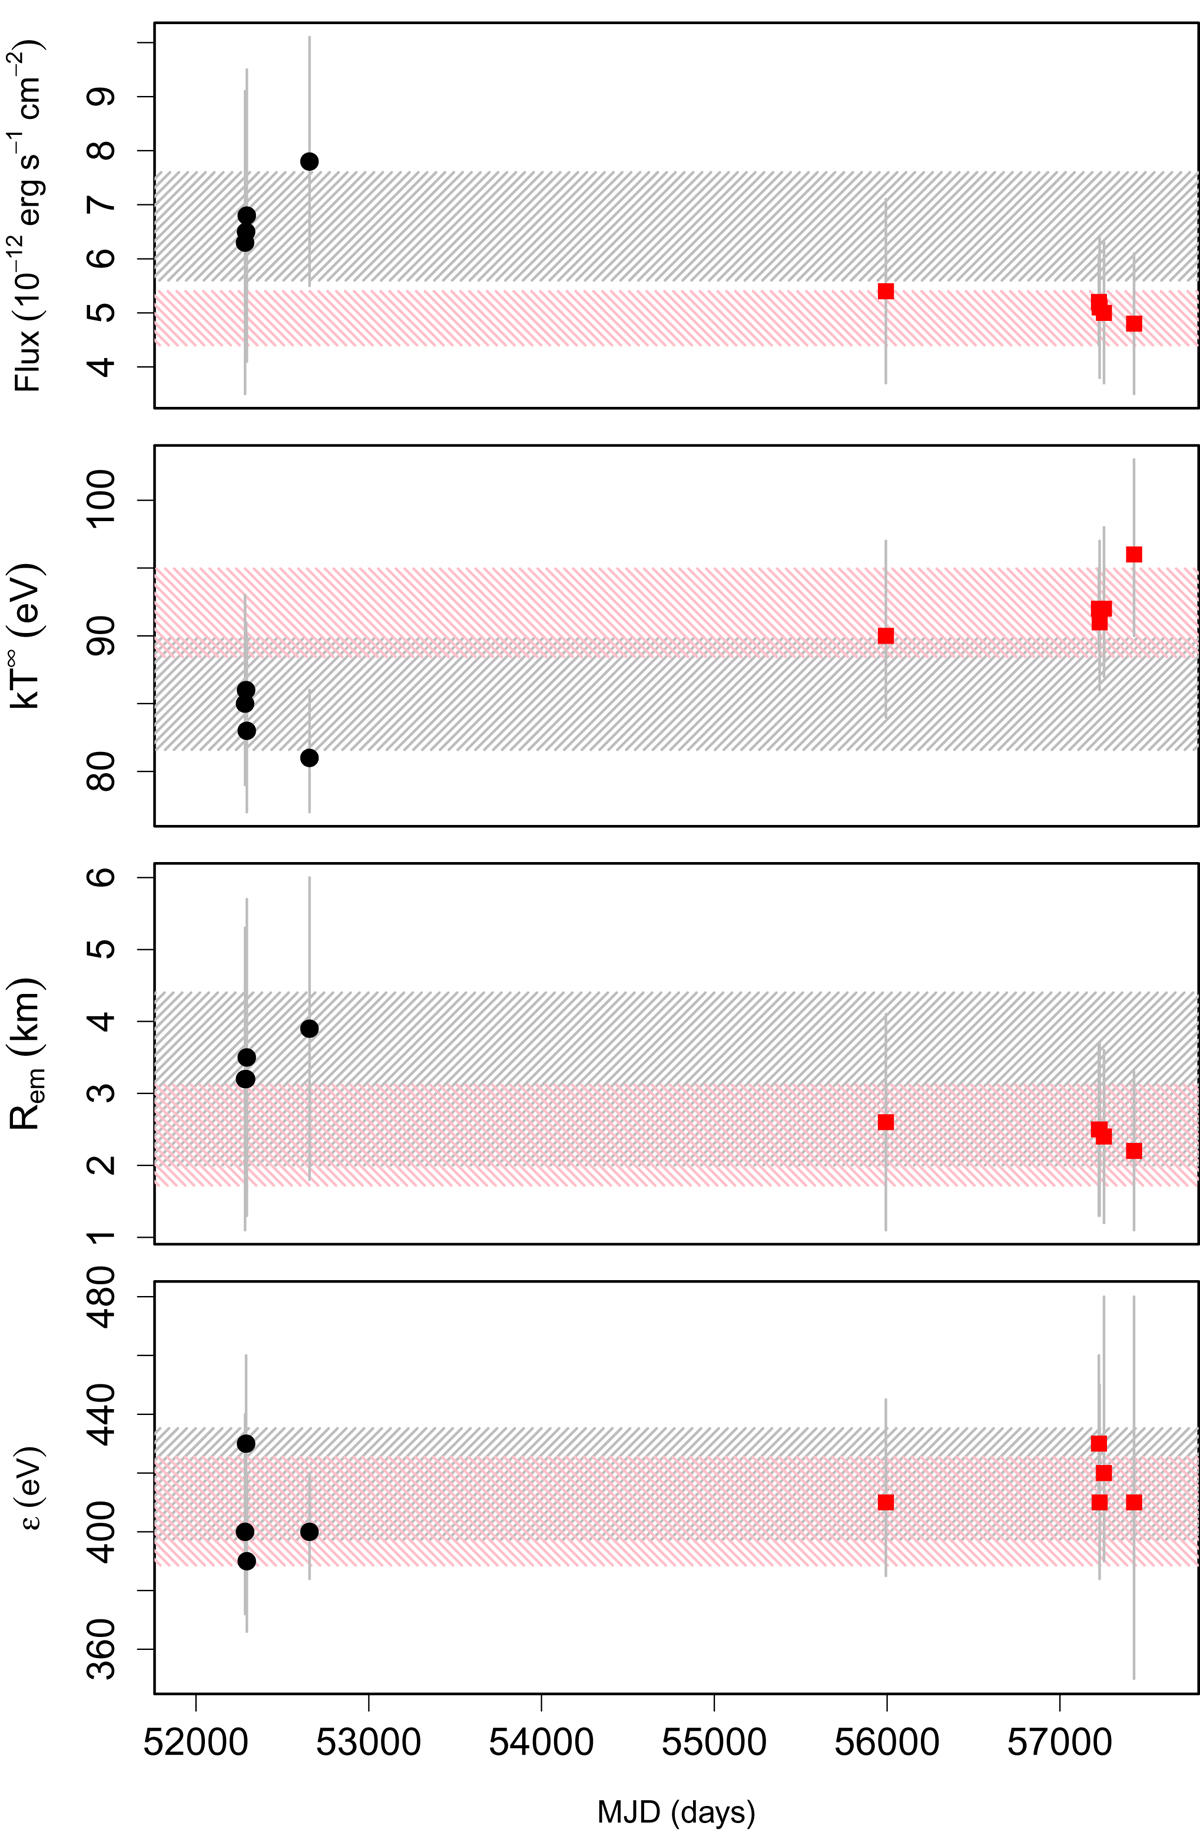
Spectral parameters of J1605 as a function of time as measured in the RGS observations (data points; see text and Table 8 for details). The model fit to the observations in XSPEC is tbabs(bbody-gauss). Circles (black) and squares (red) show the subgroups of old and new observations of the source, obtained respectively in 2002/2003 and after 2012. The analysis of EPIC data (see Fig. 2) are for the observations in the new subgroup (MJD > 56 000). Shaded areas are the results of the fits of RGS1/2 stacked spectra in the two subgroups, with 1σ standard deviations.
Current usage metrics show cumulative count of Article Views (full-text article views including HTML views, PDF and ePub downloads, according to the available data) and Abstracts Views on Vision4Press platform.
Data correspond to usage on the plateform after 2015. The current usage metrics is available 48-96 hours after online publication and is updated daily on week days.
Initial download of the metrics may take a while.