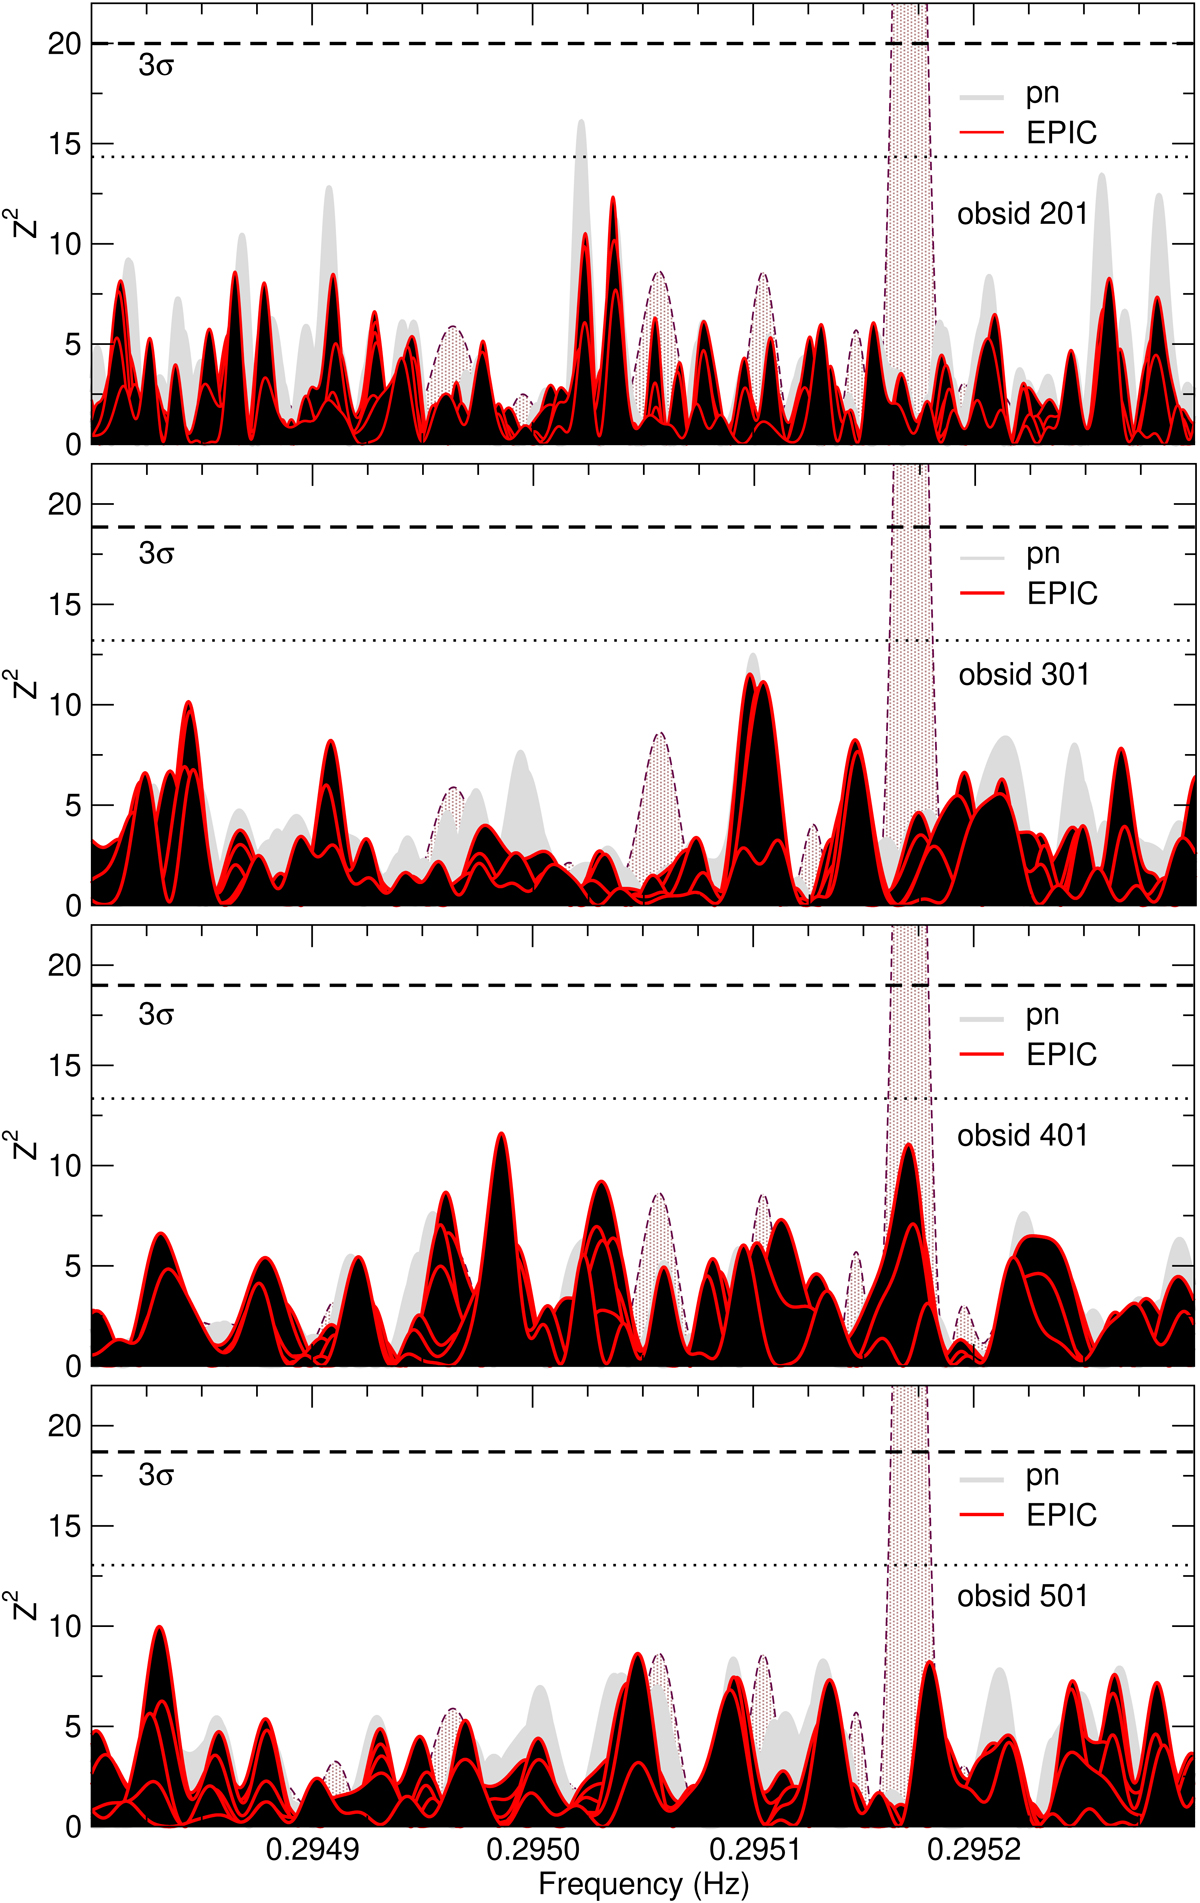
Fig. 1.
![]() EPIC and pn searches around the 2012 periodicity. The frequency range is ν = 0.2948−0.2953 Hz. The periodogram in the background (dashed outline) shows the 2012 result: ν2012 = 0.2951709(14) Hz and
EPIC and pn searches around the 2012 periodicity. The frequency range is ν = 0.2948−0.2953 Hz. The periodogram in the background (dashed outline) shows the 2012 result: ν2012 = 0.2951709(14) Hz and ![]() (ν2012) ∼ 50 (obsid 0671620101, pn, 0.5–1.35 keV). The four plots show for each AO14 observation the results of tests conducted in seven different energy bands for an extraction region of 100″ (see text). The dotted and dashed horizontal lines show the 2σ and 3σ confidence levels for the detection of modulations in each observation.
(ν2012) ∼ 50 (obsid 0671620101, pn, 0.5–1.35 keV). The four plots show for each AO14 observation the results of tests conducted in seven different energy bands for an extraction region of 100″ (see text). The dotted and dashed horizontal lines show the 2σ and 3σ confidence levels for the detection of modulations in each observation.
Current usage metrics show cumulative count of Article Views (full-text article views including HTML views, PDF and ePub downloads, according to the available data) and Abstracts Views on Vision4Press platform.
Data correspond to usage on the plateform after 2015. The current usage metrics is available 48-96 hours after online publication and is updated daily on week days.
Initial download of the metrics may take a while.