Fig. 7
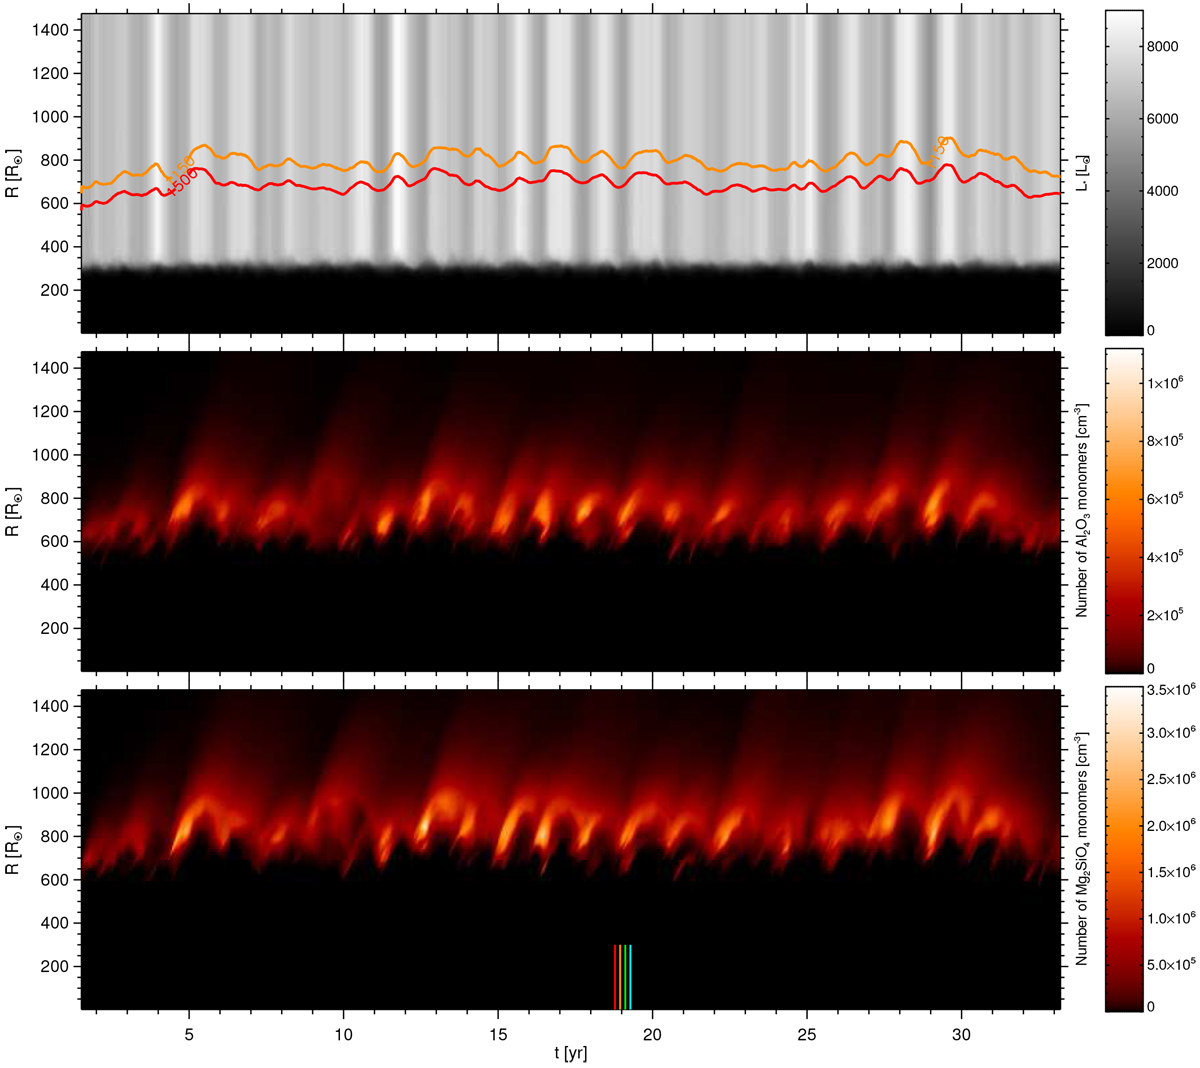
Spherical averages of luminosity (integrated radiative flux; top panel), corundum density (middle panel), and silicate density (bottom panel) in model st28gm06n038, as a function of radial distance and time. In the top panel, two isotherms with temperatures representative of corundum and silicate condensation are shown (at 1500 and 1150 K, respectively, same as in Figs. 2 and 6), to demonstrate the interplay between variable radiative heating and the inner edges of dust layers. The dark area in the lower part of the top panel represents the deep stellar interior, where most of the energy flux is transported by convection. The colored vertical lines in the bottom panel mark the instants selected for Figs. 2 and 3.
Current usage metrics show cumulative count of Article Views (full-text article views including HTML views, PDF and ePub downloads, according to the available data) and Abstracts Views on Vision4Press platform.
Data correspond to usage on the plateform after 2015. The current usage metrics is available 48-96 hours after online publication and is updated daily on week days.
Initial download of the metrics may take a while.