Fig. 4
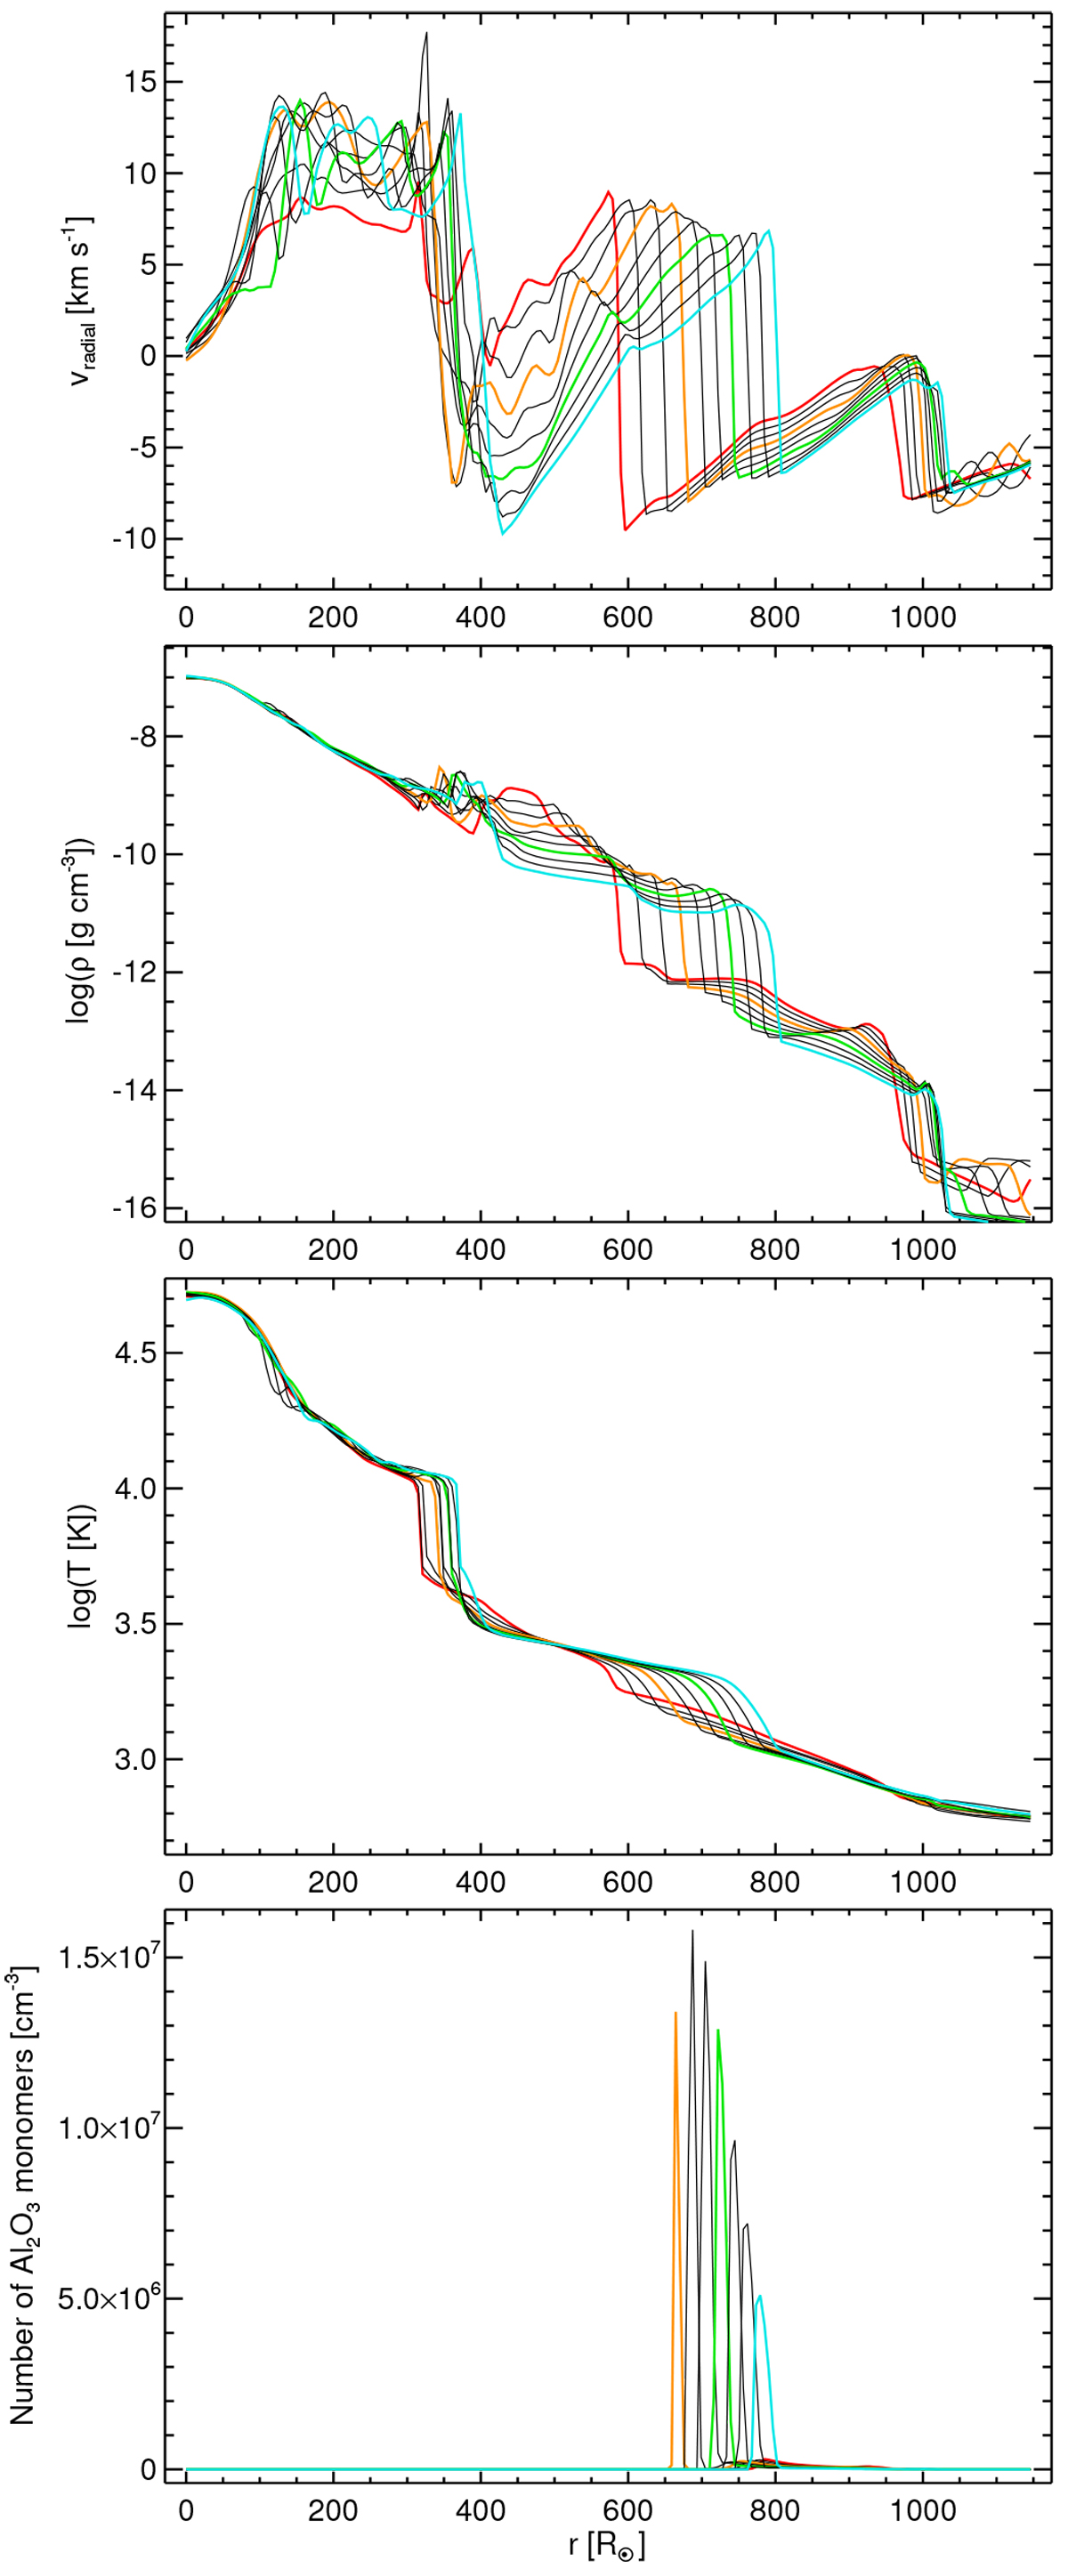
One-dimensional radial profiles of velocity, gas density, temperature, and corundum density, showing the formation of a new dust cloud (appearing in the upper right quadrant of Fig. 3). The colors (red, orange, green, and blue) mark the four time steps selected in Figs. 2 and 3, the black lines show intermediate snapshots, 1.75 × 10⁶ s (20.3 d) apart. The sharp drop in temperature from 10 000 to about 4000 K marks the transition from the convection-dominated interior to the shock-dominated atmosphere.
Current usage metrics show cumulative count of Article Views (full-text article views including HTML views, PDF and ePub downloads, according to the available data) and Abstracts Views on Vision4Press platform.
Data correspond to usage on the plateform after 2015. The current usage metrics is available 48-96 hours after online publication and is updated daily on week days.
Initial download of the metrics may take a while.