Fig. 3
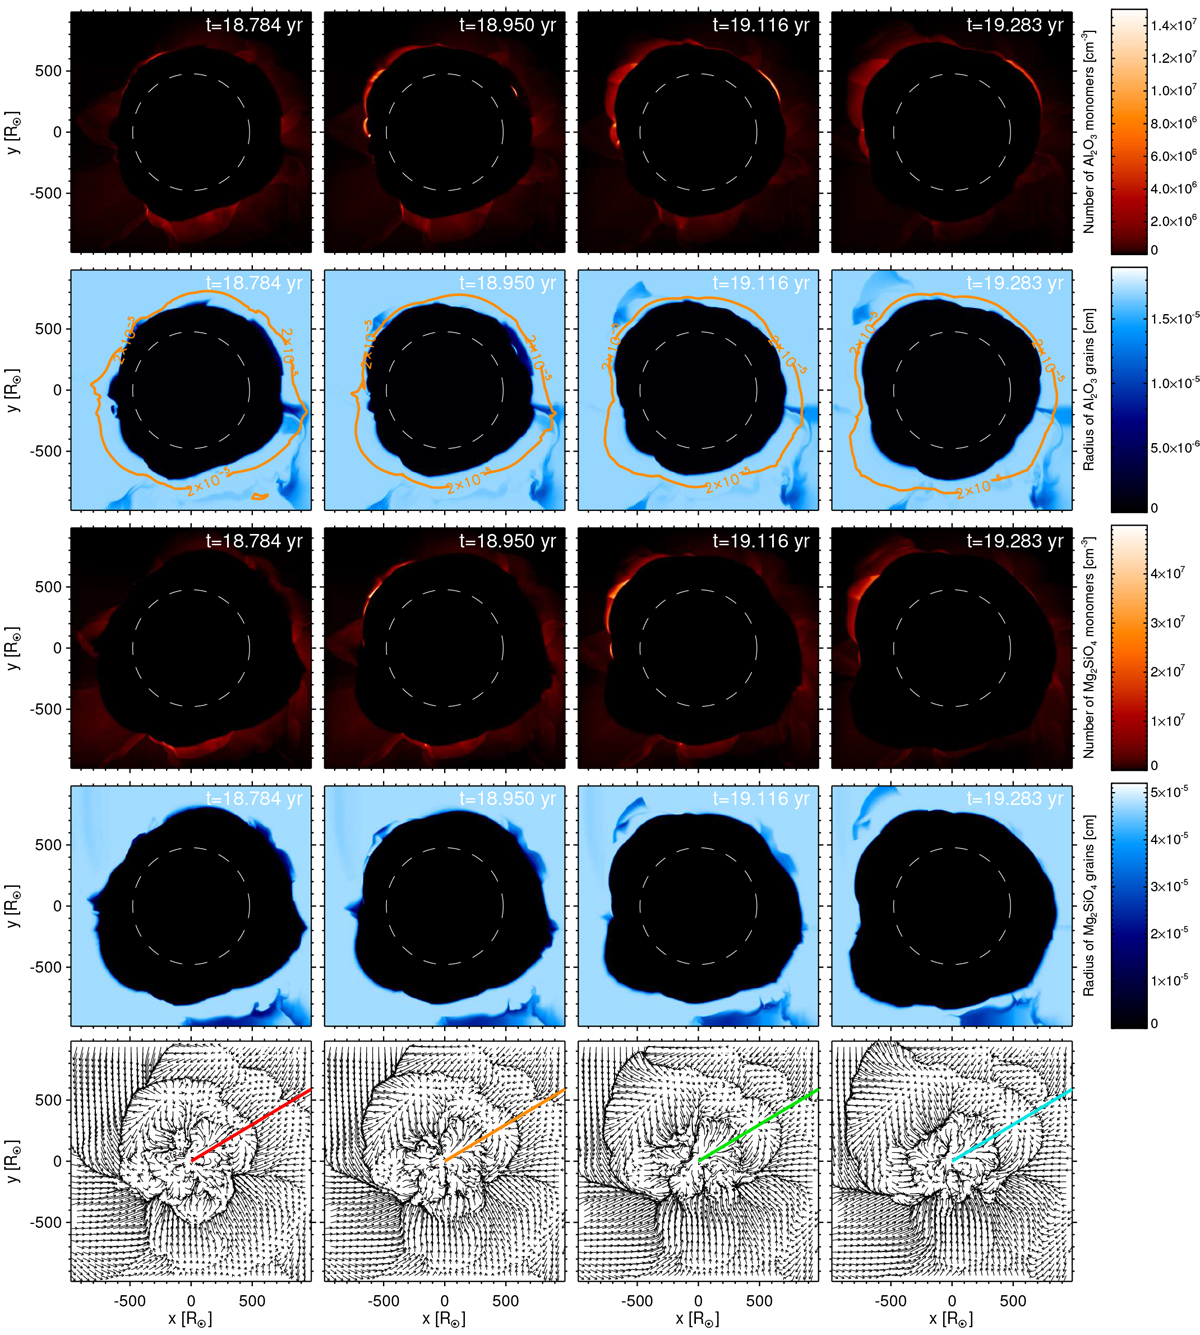
Time sequences of corundum density, corundum grain radius, silicate density, and silicate grain radius for slices through the center of model st28gm06n038 (rows 1–4). The dashed circle marks the estimated stellar radius of 478 R⊙. The over-plotted contour in the corundum grain size panels (row 2) marks where silicate grains (row 4) have reached a radius of 0.2 μm, probably indicating the outer edge of the gravitationally bound dust layers (see text). Row 5 visualizes the dynamics with pseudo-streamlines (integrated over 106 s; the colored lines indicate the radial ray used in Fig. 4). Shock fronts appear as regions where flows with different directions collide. The snapshots are about 2 months apart.
Current usage metrics show cumulative count of Article Views (full-text article views including HTML views, PDF and ePub downloads, according to the available data) and Abstracts Views on Vision4Press platform.
Data correspond to usage on the plateform after 2015. The current usage metrics is available 48-96 hours after online publication and is updated daily on week days.
Initial download of the metrics may take a while.