Fig. 2
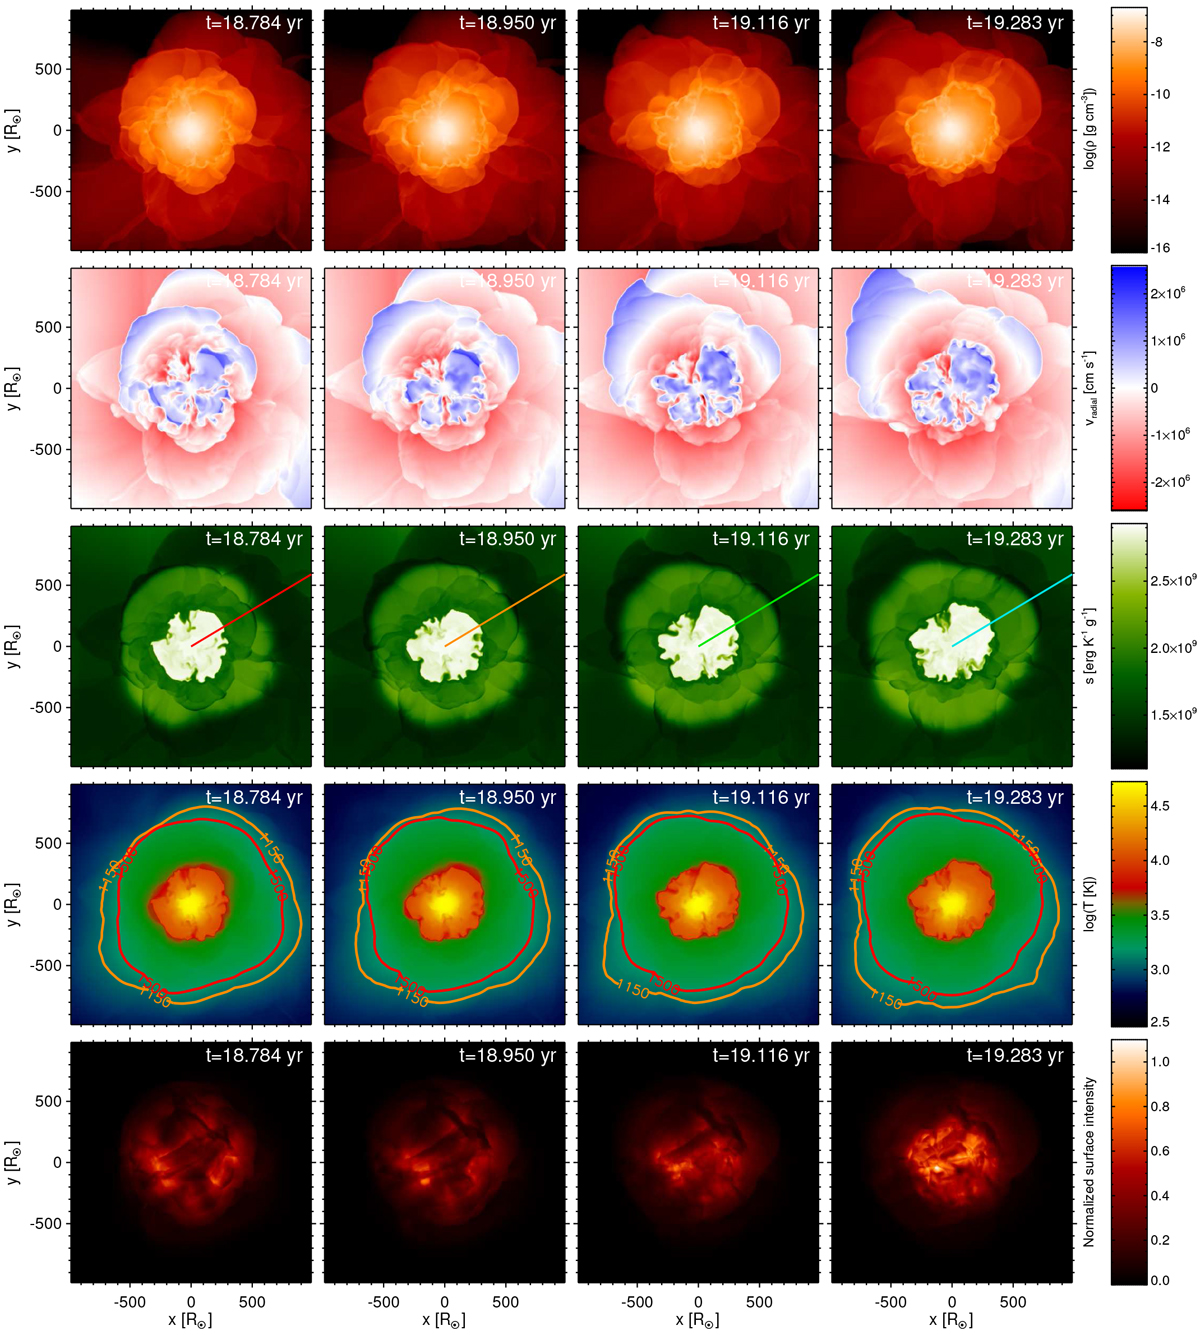
Time sequences of density, radial velocity, entropy, and temperature for slices through the center of model st28gm06n038 (rows 1–4), and the variation of relative surface intensity (bottom row). The snapshots are about 2 months apart (see the counter in the top of the panels). Colored lines in the middle row indicate the radial ray used in Fig. 4, following the emergence of a new dust cloud. The contour lines in the temperature panels at 1500 and1150 K roughly correspond to the inner edges of the corundum and silicate dust layers, respectively (see Fig. 6).
Current usage metrics show cumulative count of Article Views (full-text article views including HTML views, PDF and ePub downloads, according to the available data) and Abstracts Views on Vision4Press platform.
Data correspond to usage on the plateform after 2015. The current usage metrics is available 48-96 hours after online publication and is updated daily on week days.
Initial download of the metrics may take a while.