Fig. 9
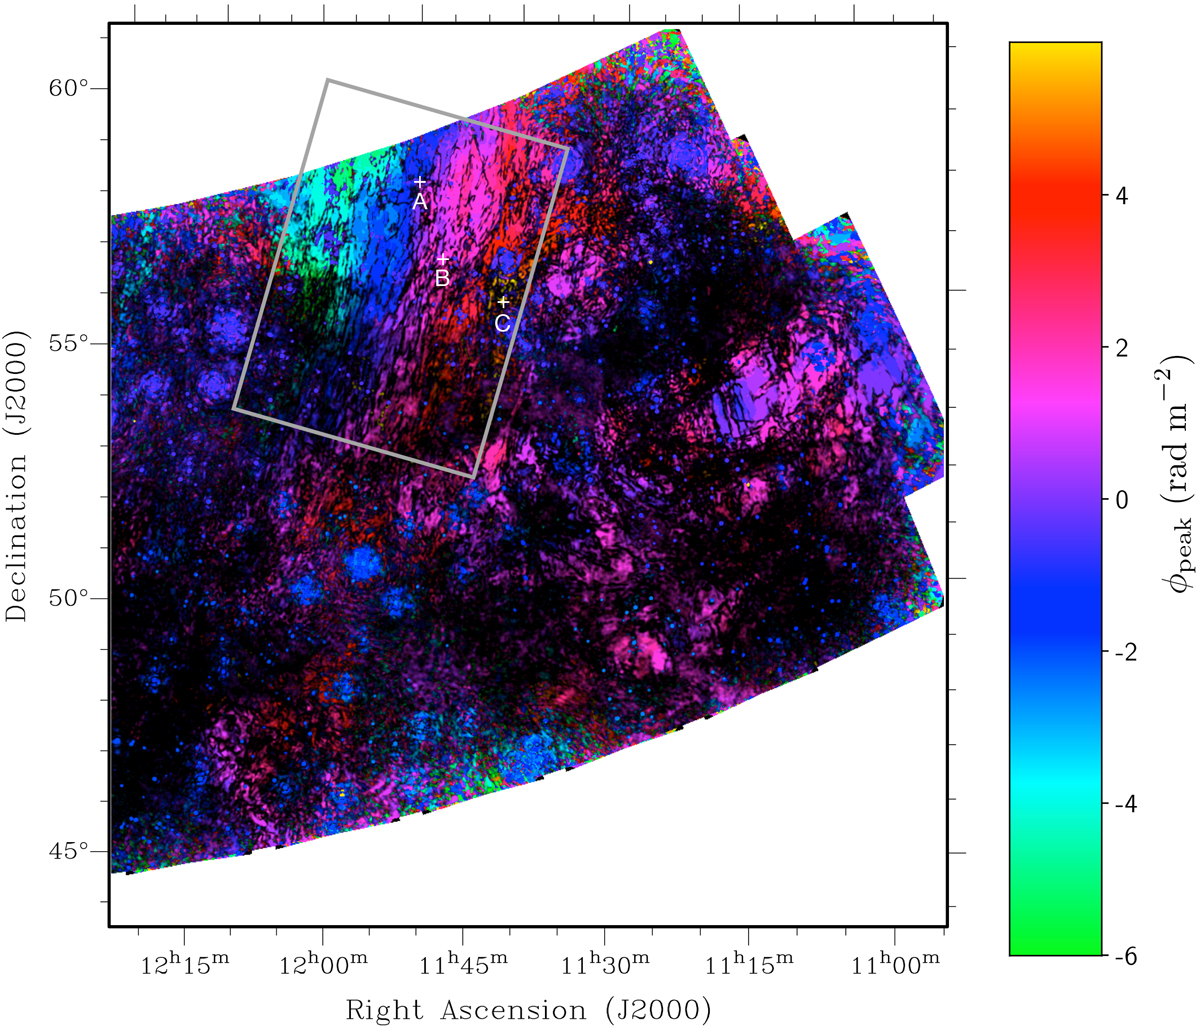
Collapsed view of the west region of the mosaic, where the polarized intensity and Faraday depth of the brightest feature in the Faraday depth spectrum were used to determine the brightness and color respectively. The features in the north west and north center, marked by the gray box and described in Sect. 3.2.1, can be clearly seen as sheets of polarized emission with Faraday rotation gradients, while the feature in the southwest shows much more patchy structure in polarized intensity. The instrumental leakage causes bright Stokes I sources to appear as small blue circular features. The three crosses mark the locations of the spectra shown in Fig. 12.
Current usage metrics show cumulative count of Article Views (full-text article views including HTML views, PDF and ePub downloads, according to the available data) and Abstracts Views on Vision4Press platform.
Data correspond to usage on the plateform after 2015. The current usage metrics is available 48-96 hours after online publication and is updated daily on week days.
Initial download of the metrics may take a while.