Free Access
Fig. 14
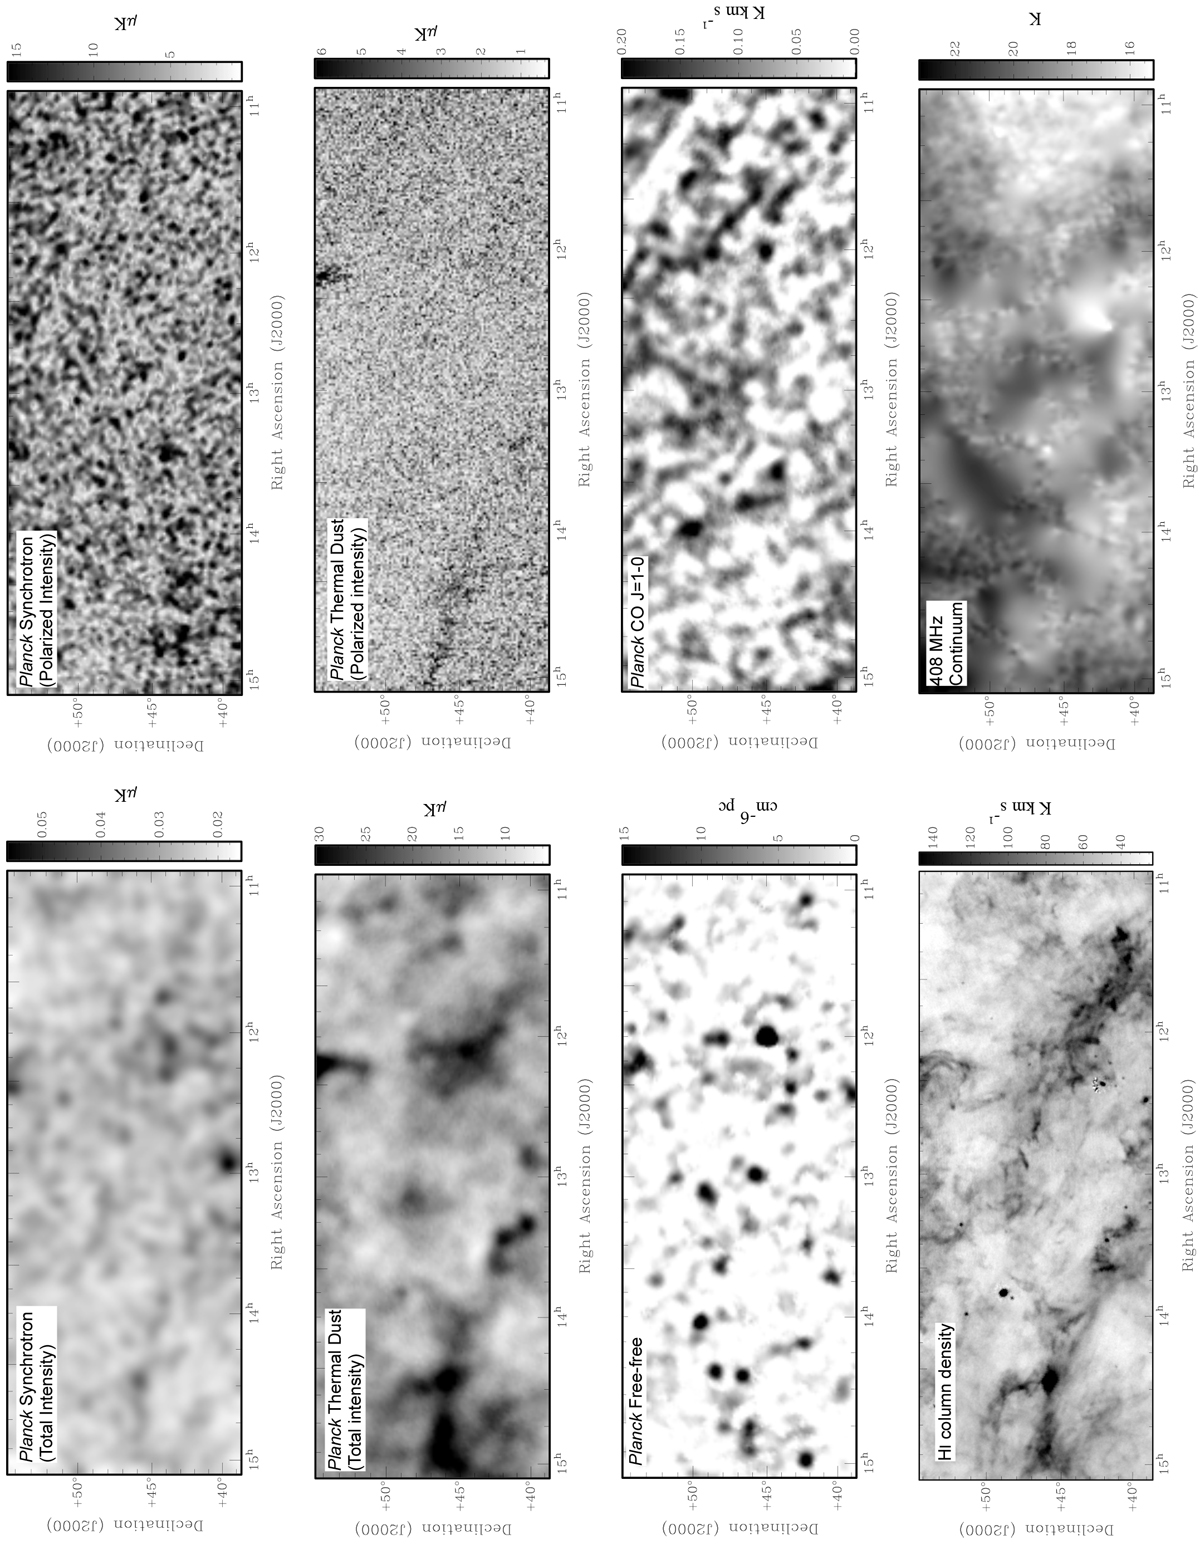
Selected ISM tracers, in the same coordinates and projection as the previous images. The H I filament in the southeast region of the field is well correlated, but slightly offset in position, with the steep linear gradient in Faraday depth described in Sect. 3.2.3; this is shown in more detail in Fig. 11.
Current usage metrics show cumulative count of Article Views (full-text article views including HTML views, PDF and ePub downloads, according to the available data) and Abstracts Views on Vision4Press platform.
Data correspond to usage on the plateform after 2015. The current usage metrics is available 48-96 hours after online publication and is updated daily on week days.
Initial download of the metrics may take a while.