Fig. 11
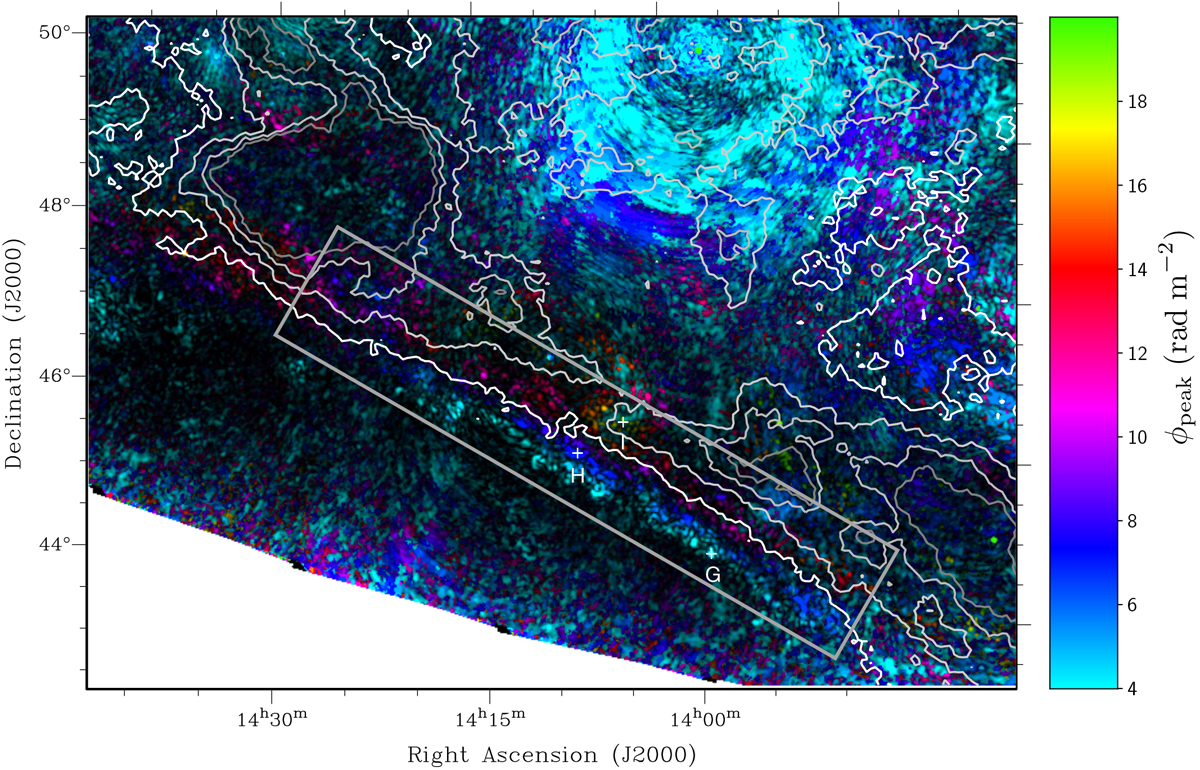
As Fig. 9, focusing on the region around the southeast “filament” described in Sect. 3.2.3 and marked by the gray box. The contours are the H I intensity integrated over the velocity range − 46 to − 40 km s−1 and were selected to highlight the H I filament present in this region; the levels are 3, 6, 9, and 12 K km s−1 transitioning from white to dark gray. The smooth gradient in the Faraday depth is located below the edge of the H I filament, while inside the filament the Faraday depth behavior is more complex. Leakage from the bright source 3C295 dominate the top of the image. The three crosses mark the locations of the spectra shown in Fig. 12.
Current usage metrics show cumulative count of Article Views (full-text article views including HTML views, PDF and ePub downloads, according to the available data) and Abstracts Views on Vision4Press platform.
Data correspond to usage on the plateform after 2015. The current usage metrics is available 48-96 hours after online publication and is updated daily on week days.
Initial download of the metrics may take a while.