Fig. 10
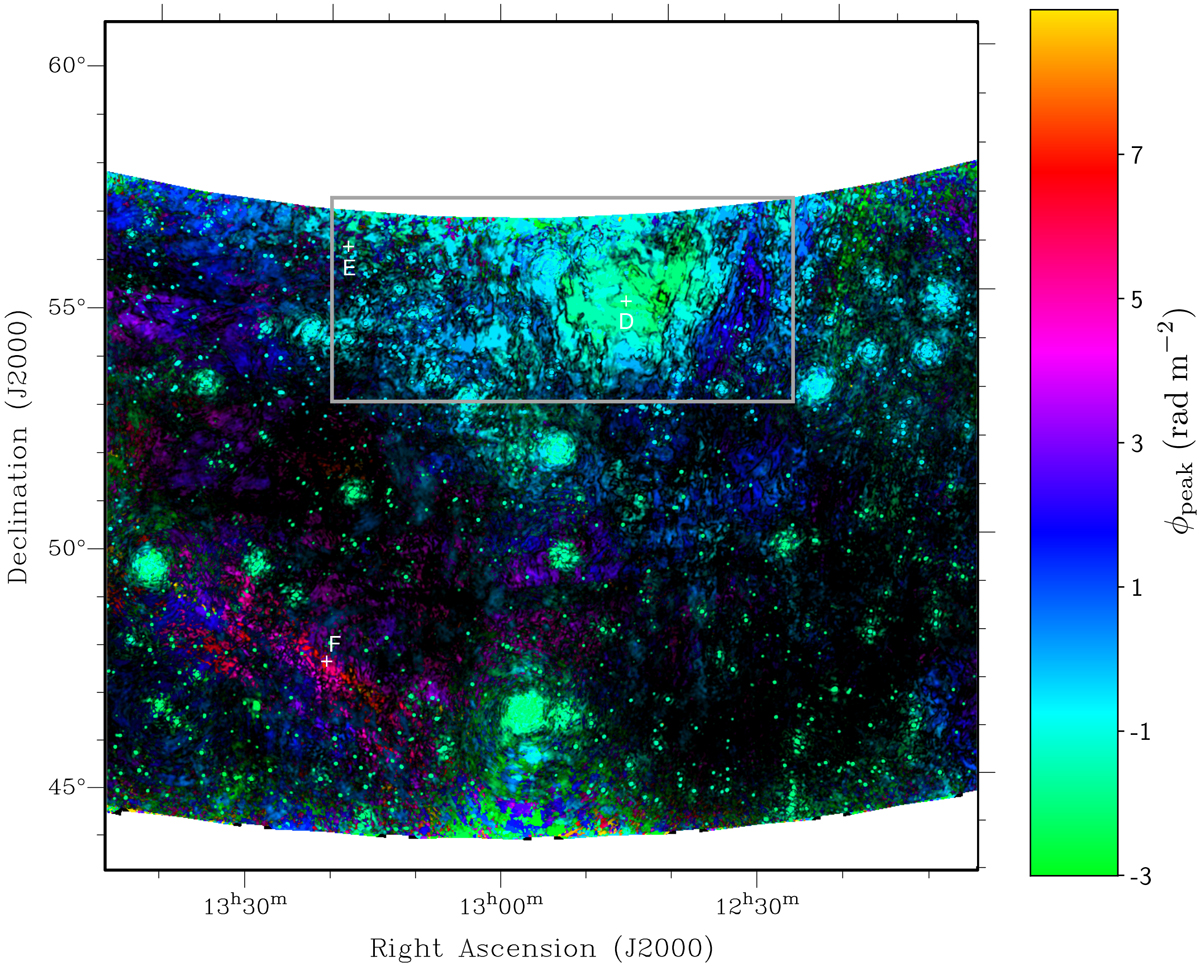
As Fig. 9, but for the central region of the mosaic described in Sect. 3.2.2. The brightest region in the top, right of center and marked by the gray box, shows a minimum in Faraday depth of − 3 rad m−2, with increasing Faraday depth in the surrounding regions. The three crosses mark the locations of the spectra shown in Fig. 12.
Current usage metrics show cumulative count of Article Views (full-text article views including HTML views, PDF and ePub downloads, according to the available data) and Abstracts Views on Vision4Press platform.
Data correspond to usage on the plateform after 2015. The current usage metrics is available 48-96 hours after online publication and is updated daily on week days.
Initial download of the metrics may take a while.