Fig. 8.
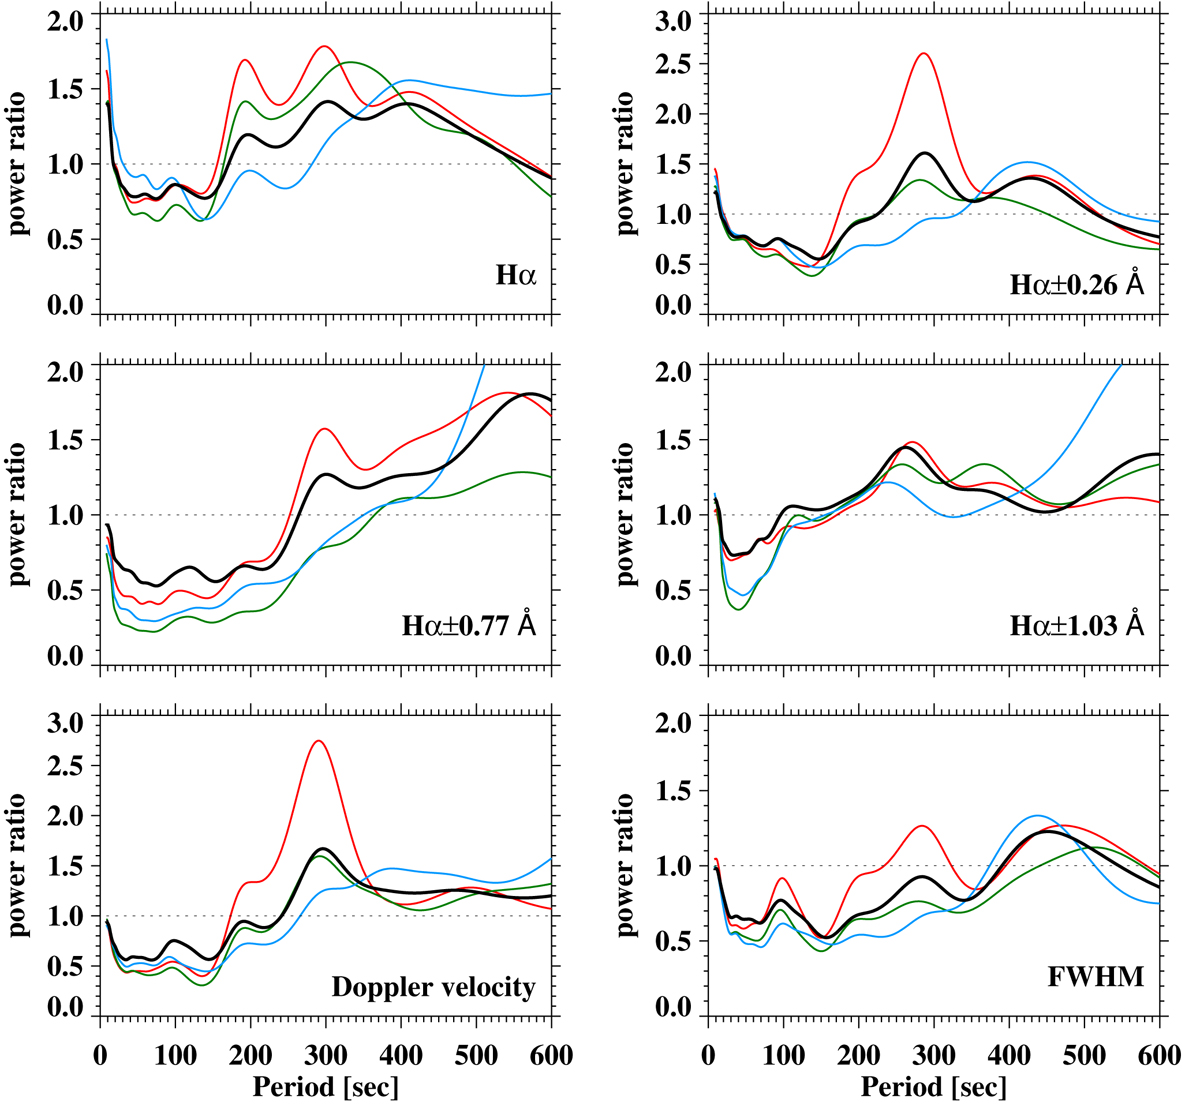
Ratio between average power within vortex-related areas and average power within the selected QSR (see Fig. 1) for different Hα wavelengths, Hα Doppler velocity, and Hα FWHM. The black line corresponds to the ratio for the whole vortex area, and the colour lines correspond to ratios within swirls that are denoted with the same colours in Fig. 1.
Current usage metrics show cumulative count of Article Views (full-text article views including HTML views, PDF and ePub downloads, according to the available data) and Abstracts Views on Vision4Press platform.
Data correspond to usage on the plateform after 2015. The current usage metrics is available 48-96 hours after online publication and is updated daily on week days.
Initial download of the metrics may take a while.