Fig. 5.
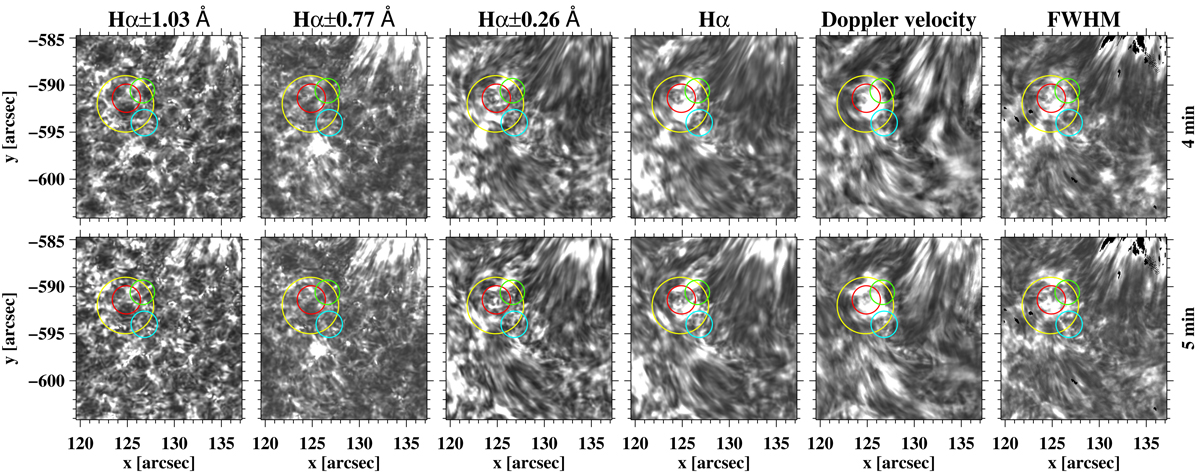
2D power maps at the 4 and 5 min period bands (top and bottom row, respectively) in the Hα ± 1.03 Å, Hα ± 0.77 Å, Hα ± 0.26 Å, Hα line centre, Hα Doppler velocity, and FWHM for the second observing period (08:28 UT–09:16 UT). The two period bands of 1 min width are centred around the respective periods, while the greyscaling in each panel is within ±2σ from the respective mean power value of the whole image, with σ corresponding to the respective standard deviation. The overplotted yellow, red, green, and cyan circles indicate the location of the analysed conspicuous vortex flow and of the smaller swirls indicated in Fig. 1.
Current usage metrics show cumulative count of Article Views (full-text article views including HTML views, PDF and ePub downloads, according to the available data) and Abstracts Views on Vision4Press platform.
Data correspond to usage on the plateform after 2015. The current usage metrics is available 48-96 hours after online publication and is updated daily on week days.
Initial download of the metrics may take a while.