Fig. 4.
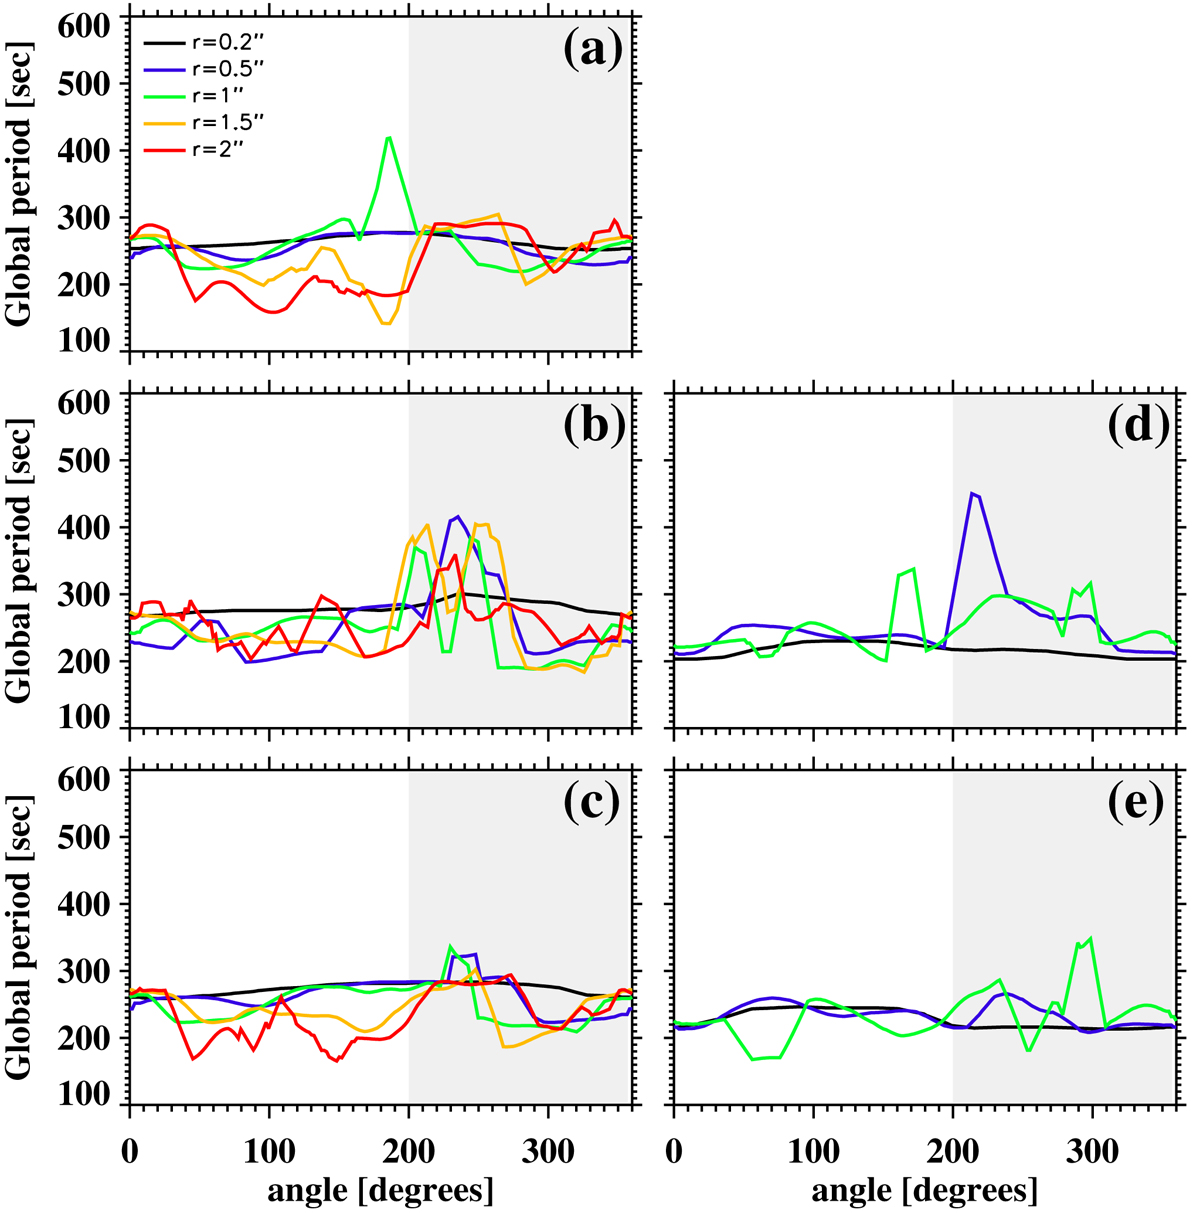
Rotation periods (below 500 s) derived for the Hα Doppler velocity time-series (panel a) and intensity time-series at Hα line centre (panel b), Hα − 0.26 Å (panel c), Ca II 8542 Å line centre (panel d), and Ca II − 0.055 Å (panel e) for the second observing period (08:28 UT–09:16 UT) as a function of angle and for different values of radius r from the approximate centre of the vortex flow (the respective colours are indicated in the top panel). Radii extend only up to 2″ for Hα, and for Ca II 8542 Å are limited up to 1″ because only the central swirl and within this radius is visible in this line (see Sect. 3). Angles are measured in a clockwise direction starting from position 0, which is clearly marked in Fig. 1 to the right of the vortex flow. All curves have been smoothed with a running average corresponding to ∼20° to remove spurious spikes. Grey-shaded areas indicate angles where the vortex flow is mostly affected by the dynamics of nearby fibril-like flows.
Current usage metrics show cumulative count of Article Views (full-text article views including HTML views, PDF and ePub downloads, according to the available data) and Abstracts Views on Vision4Press platform.
Data correspond to usage on the plateform after 2015. The current usage metrics is available 48-96 hours after online publication and is updated daily on week days.
Initial download of the metrics may take a while.