Fig. 3.
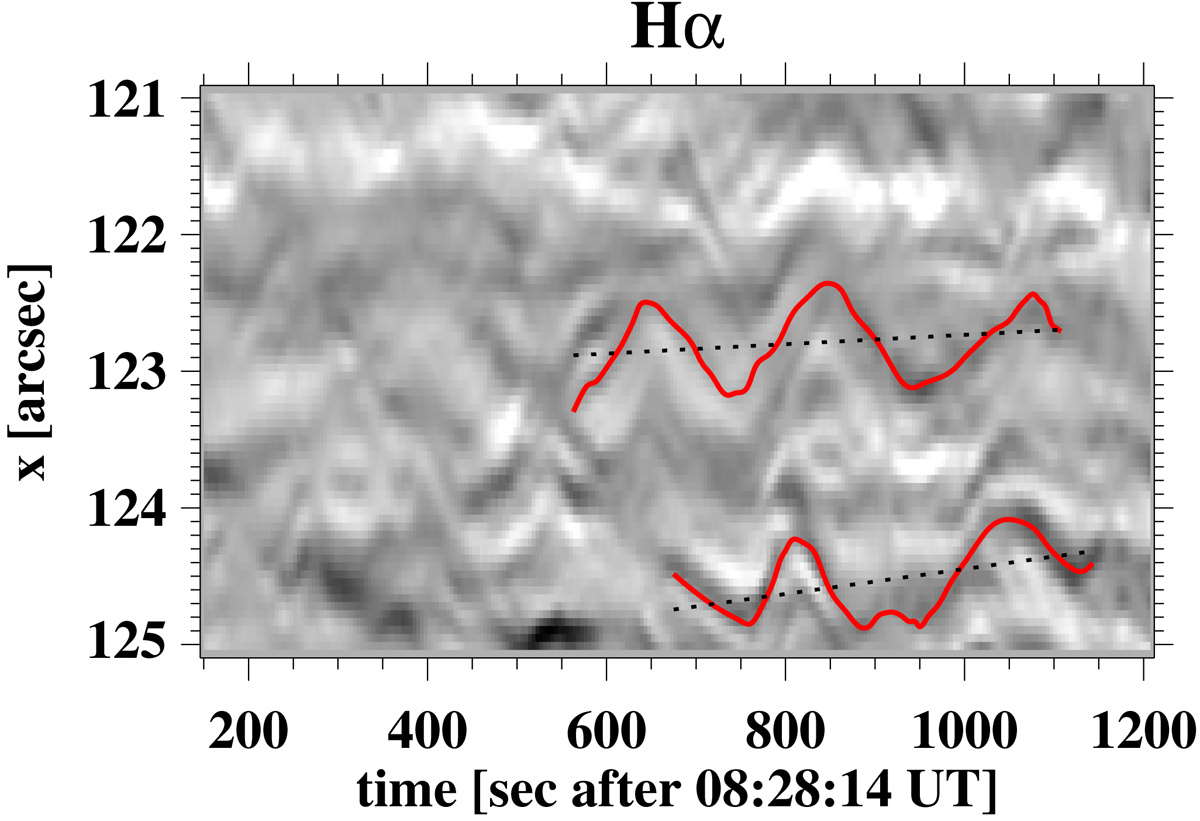
Time-slice contrast-enhanced intensity along a horizontal slit passing from the approximate visual centre of the swirl found within the red circle in Fig. 1. This figure corresponds to a cut-out of the respective time-slice panel (top second panel) of Fig. 9 in Paper I. The contrast-enhanced intensity corresponds to the Hα line-centre intensity convolved with the standard Interactive Data Language (IDL) emboss function, a procedure that helps to locate edges in an image. The overplotted red lines follow the temporal evolution of two different visually identified spiral arms of this swirl, and the dotted black lines indicate the linear trend of their radial motion.
Current usage metrics show cumulative count of Article Views (full-text article views including HTML views, PDF and ePub downloads, according to the available data) and Abstracts Views on Vision4Press platform.
Data correspond to usage on the plateform after 2015. The current usage metrics is available 48-96 hours after online publication and is updated daily on week days.
Initial download of the metrics may take a while.