Fig. 2.
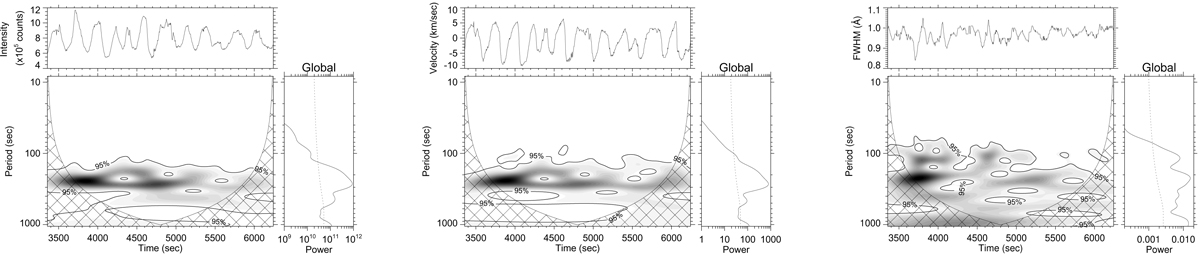
Indicative wavelet analysis figures for the Hα − 0.26 Å intensity, Hα Doppler velocity, and Hα FWHM variations (left, middle, and right figures, respectively) during the second observing interval (08:28 UT–09:16 UT) at location (x, y)=(126″, −592″), indicated by a white cross in Fig. 1. Time is in seconds starting at 07:32 UT. In each figure the top panels show the time variations of the analysed quantity (intensity, Doppler velocity, or FWHM), and the bottom left panels show the time-period calculated power spectra for the variations shown in the top panels. Filled contours correspond to the derived spectra; black represents high power values, and solid contours represent the 95% significance level. Cross-hatched regions indicate regions where edge effects of our finite time-series may become important, therefore periods within these regions should be treated with caution. The right panels in each figure show the global power spectrum, that is, the average of the wavelet power spectrum over time with the dashed line indicating the respective global significance level of 95%.
Current usage metrics show cumulative count of Article Views (full-text article views including HTML views, PDF and ePub downloads, according to the available data) and Abstracts Views on Vision4Press platform.
Data correspond to usage on the plateform after 2015. The current usage metrics is available 48-96 hours after online publication and is updated daily on week days.
Initial download of the metrics may take a while.