Fig. 10.
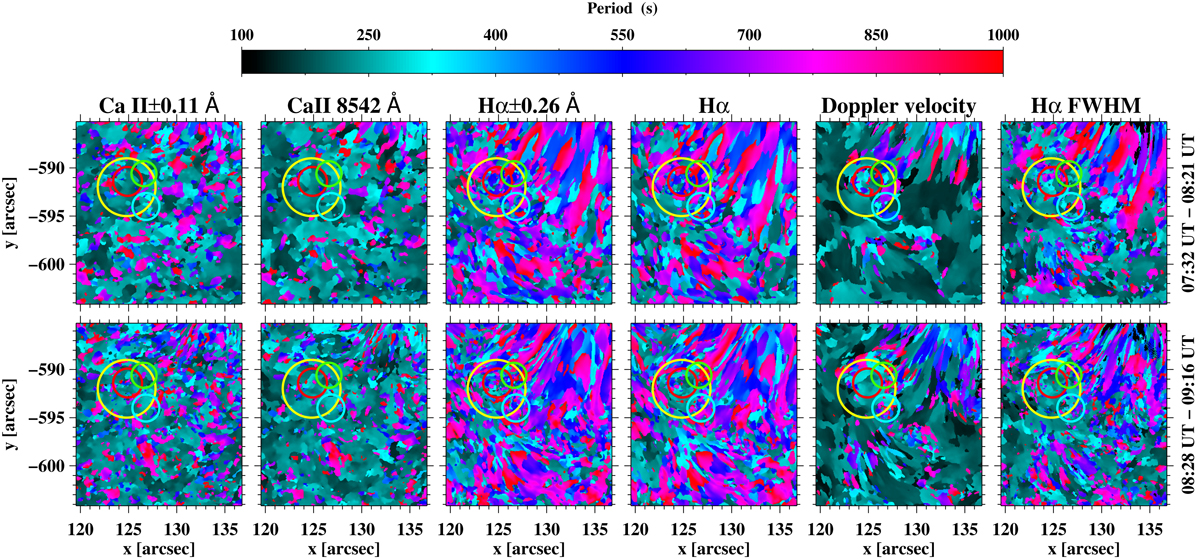
Maps of the dominant period derived from the global power spectrum within the ROI during both observing intervals (upper and lower rows, respectively) for Ca II ± 0.11 Å, Ca II 8542 Å line centre, Hα ± 0.26 Å, and Hα line centre intensity variations, and for the Hα Doppler velocity and Hα FWHM variations. The overplotted yellow, red, green, and cyan circles indicate the location of the analysed conspicuous vortex flow and of the smaller swirls indicated in Fig. 1.
Current usage metrics show cumulative count of Article Views (full-text article views including HTML views, PDF and ePub downloads, according to the available data) and Abstracts Views on Vision4Press platform.
Data correspond to usage on the plateform after 2015. The current usage metrics is available 48-96 hours after online publication and is updated daily on week days.
Initial download of the metrics may take a while.