Fig. 1.
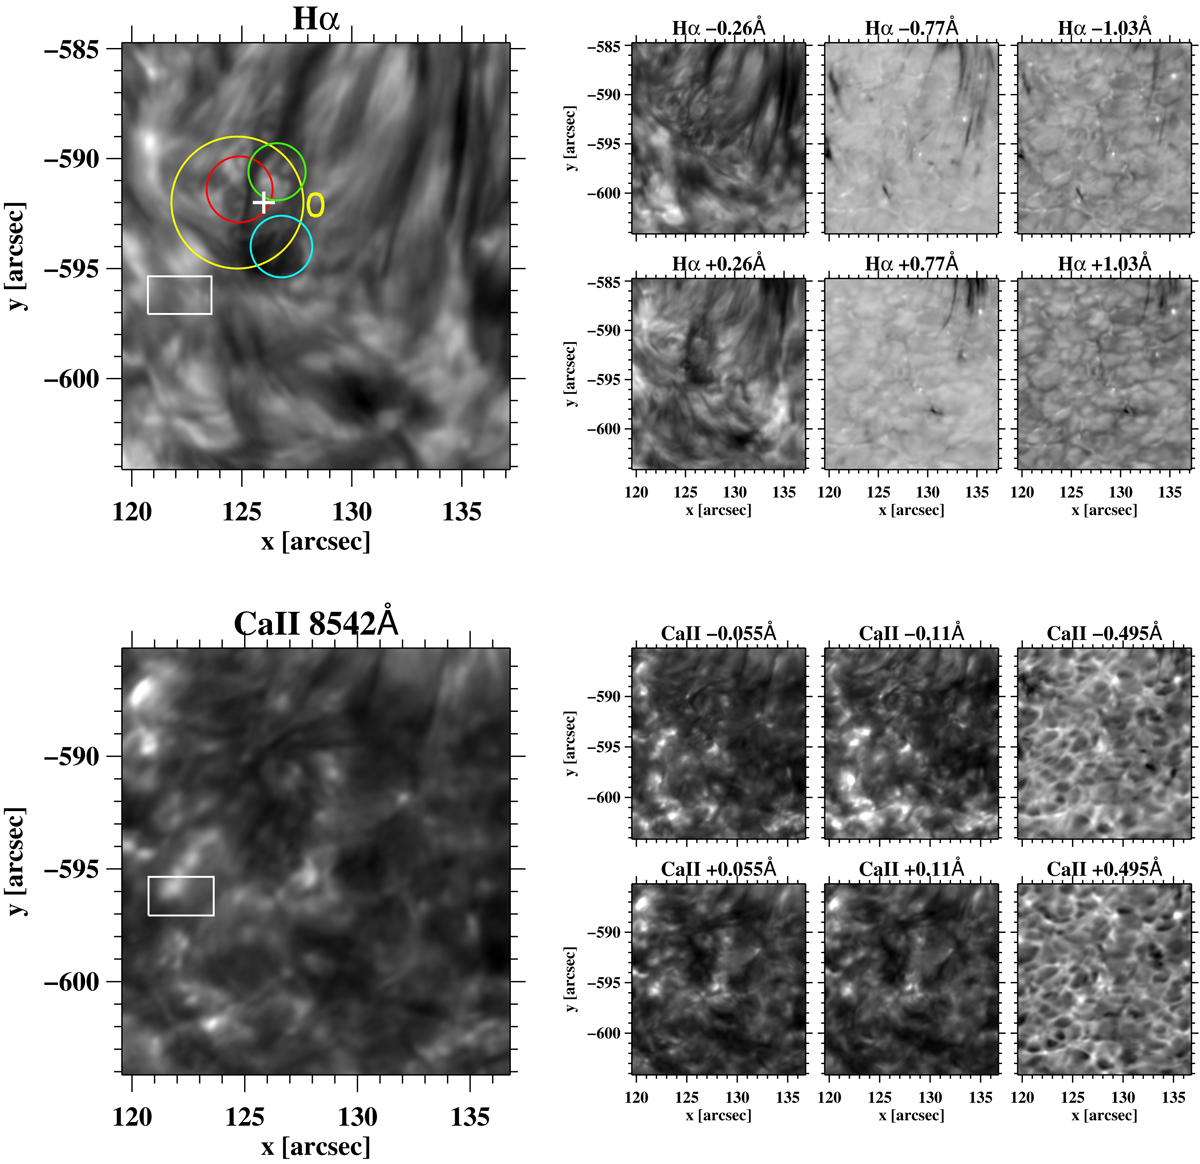
Snapshot of the ROI in all acquired wavelengths along the Hα (top row) and the Ca II 8542 Å (bottom row) line profiles, with black indicating structures in absorption. The overplotted yellow circle in the line-centre Hα panel indicates the location of the analysed conspicuous vortex flow, and smaller red, green, and cyan circles denote the approximate location of smaller swirls (substructure) that we described in Sect. 3 and extensively discussed in Paper I. The white rectangle shows the reference QSR (see text), and the white cross indicates the location of the wavelet spectra presented in Fig. 2. The yellow 0 indicates the start 0° of the clockwise angles used for the x-axis of Fig. 4.
Current usage metrics show cumulative count of Article Views (full-text article views including HTML views, PDF and ePub downloads, according to the available data) and Abstracts Views on Vision4Press platform.
Data correspond to usage on the plateform after 2015. The current usage metrics is available 48-96 hours after online publication and is updated daily on week days.
Initial download of the metrics may take a while.