Fig. B.1.
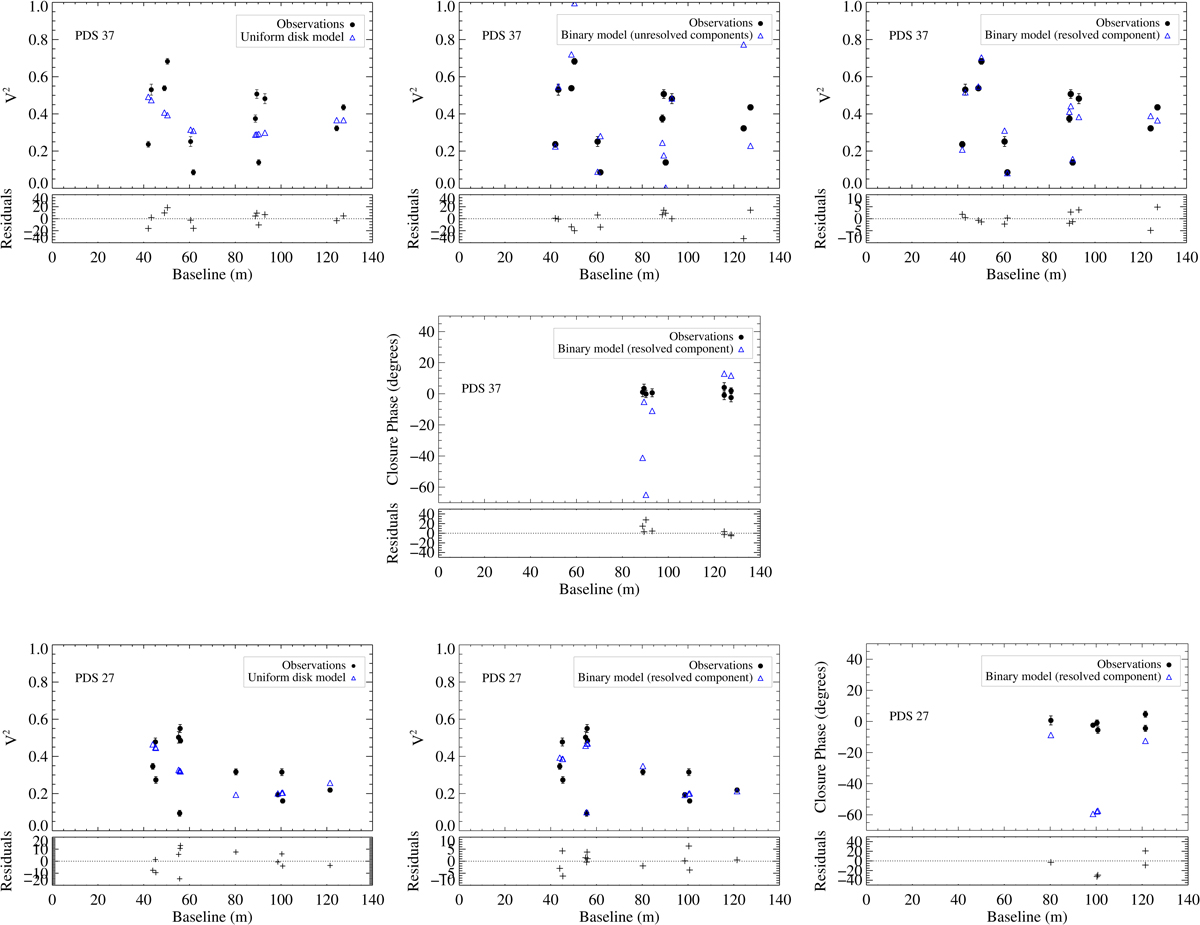
Top panel: three different models are compared with the observed visibility of PDS 37. The black circles with vertical error bars are the observed data, while the solid black triangles represent the best visibility fit. The best-fit models correspond to i) a uniform disk (left panel; χ2 = 140), ii) a point source binary (middle panel; χ2 = 220), and iii) a binary model with a resolved component (right panel; χ2 = 7.6). Bottom panel: same as for PDS 37, but for PDS 27. Two different models are compared with the observed visibility of PDS 27, i) a uniform disk model (left panel; χ2 = 90) and ii) resolved binary model (right panel; χ2 = 16). For the best visibility fit we also show the predicted vs. observed closure phases at the maximum of their spatial frequency. The observed closure phases disagree with the models.
Current usage metrics show cumulative count of Article Views (full-text article views including HTML views, PDF and ePub downloads, according to the available data) and Abstracts Views on Vision4Press platform.
Data correspond to usage on the plateform after 2015. The current usage metrics is available 48-96 hours after online publication and is updated daily on week days.
Initial download of the metrics may take a while.