Fig. 1.
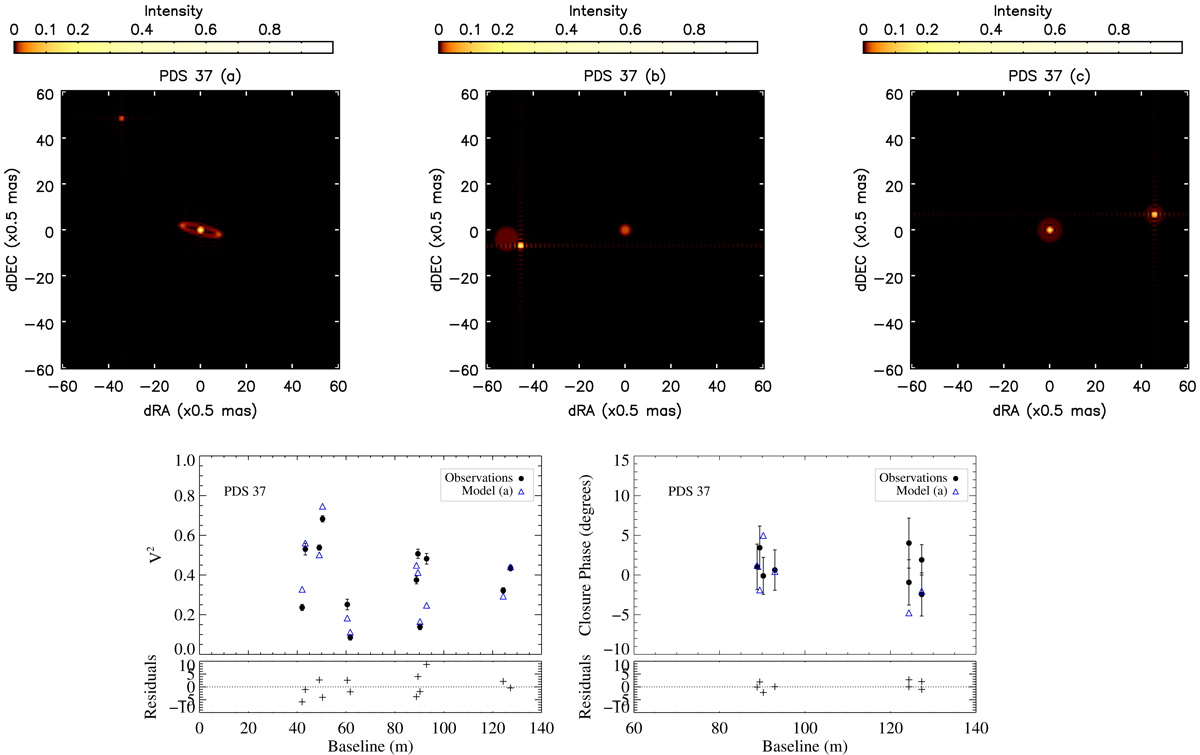
Three different geometrical models compared with the observed visibilities (V2) and closure phases of PDS 37. The black points with vertical error bars are the observed data, and the blue triangles correspond to a representative best-fit model (a). The best-fit models correspond to (panel a) a binary with a ring surrounding the primary (Red. χ2 ∼10), (panel b) a binary with both companions resolved and some asymmetric flux toward its primary (Red. χ2 ∼6), and (panel c) a binary model with both companions resolved (Red. χ2 = 10).
Current usage metrics show cumulative count of Article Views (full-text article views including HTML views, PDF and ePub downloads, according to the available data) and Abstracts Views on Vision4Press platform.
Data correspond to usage on the plateform after 2015. The current usage metrics is available 48-96 hours after online publication and is updated daily on week days.
Initial download of the metrics may take a while.