Fig. 3.
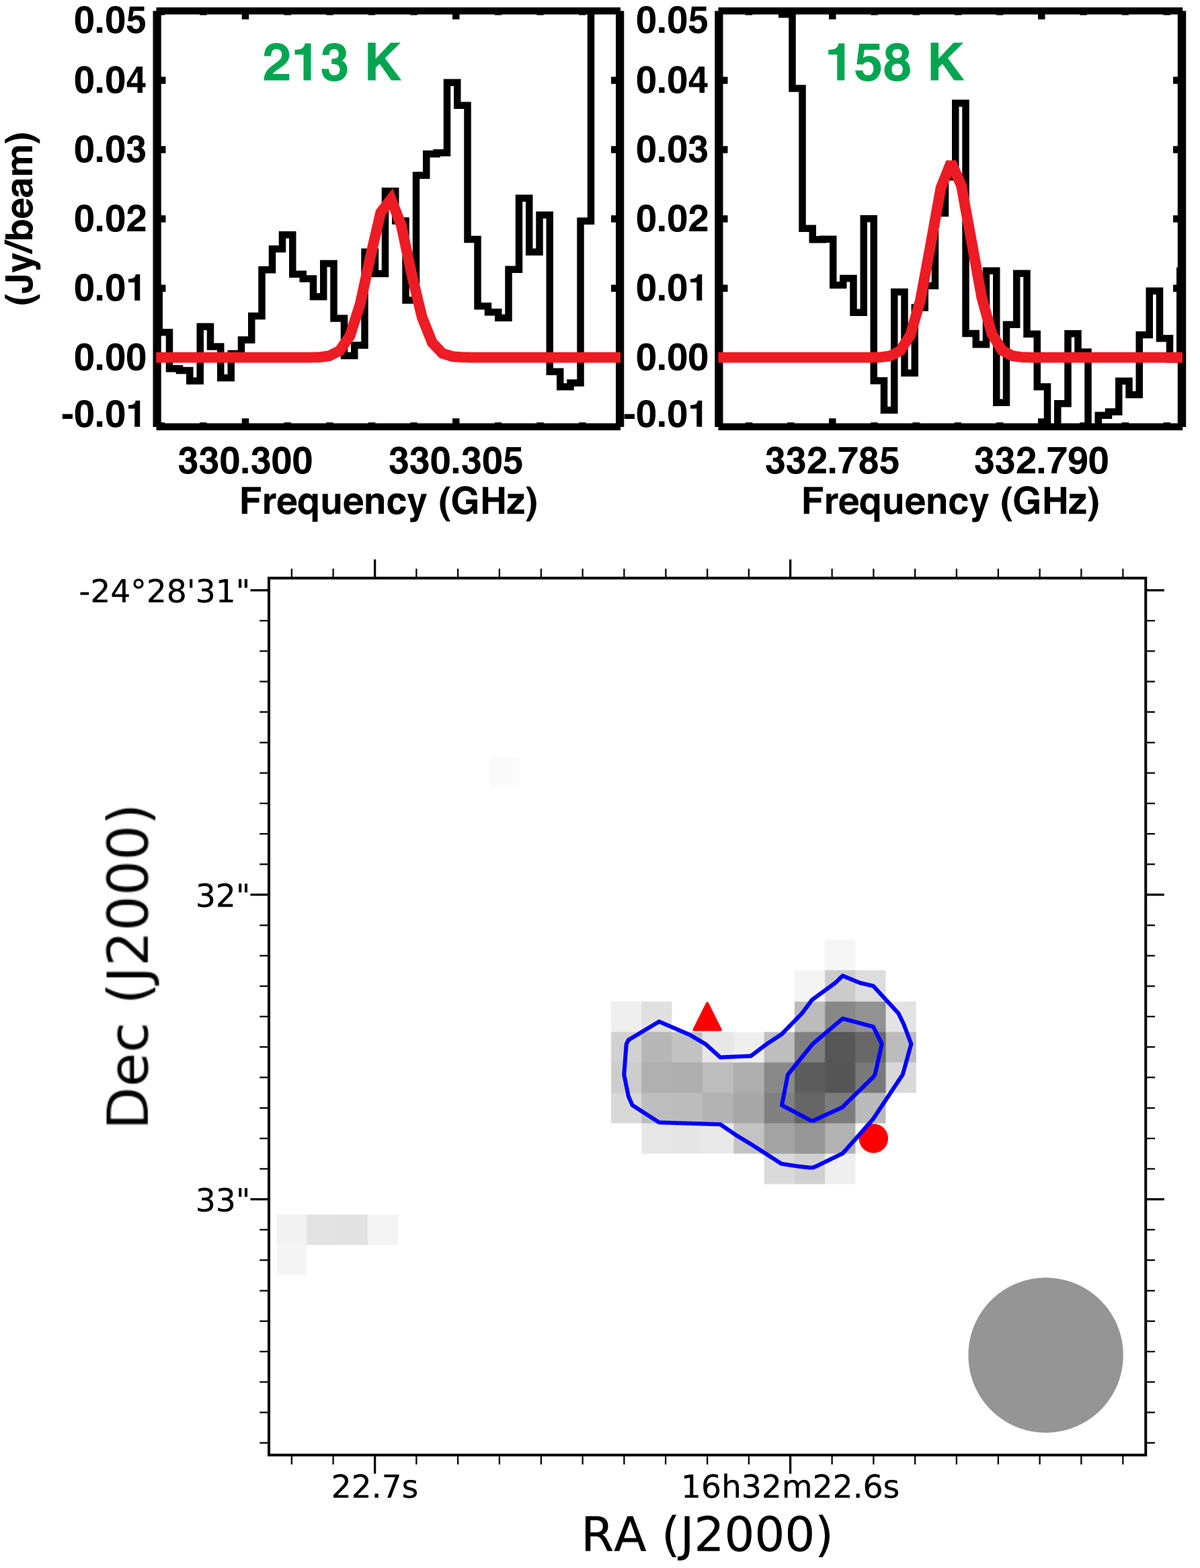
Upper panels: sections of the Protostellar Interferometric Line Survey toward a position one beam offset from source B displaying two potential lines of ![]() NCN. The model described in Sect. 5 is indicated in red. The Eup values of the two transitions are indicated in green in the upper part of each panel. Lower panel: integrated intensity map of the transition at 322.7878 GHz. The blue contours correspond to 5 and 7σ. The red triangle indicates the position of the continuum peak position, while the red circle indicates the position we analyzed (one beam offset).
NCN. The model described in Sect. 5 is indicated in red. The Eup values of the two transitions are indicated in green in the upper part of each panel. Lower panel: integrated intensity map of the transition at 322.7878 GHz. The blue contours correspond to 5 and 7σ. The red triangle indicates the position of the continuum peak position, while the red circle indicates the position we analyzed (one beam offset).
Current usage metrics show cumulative count of Article Views (full-text article views including HTML views, PDF and ePub downloads, according to the available data) and Abstracts Views on Vision4Press platform.
Data correspond to usage on the plateform after 2015. The current usage metrics is available 48-96 hours after online publication and is updated daily on week days.
Initial download of the metrics may take a while.