Fig. 4.
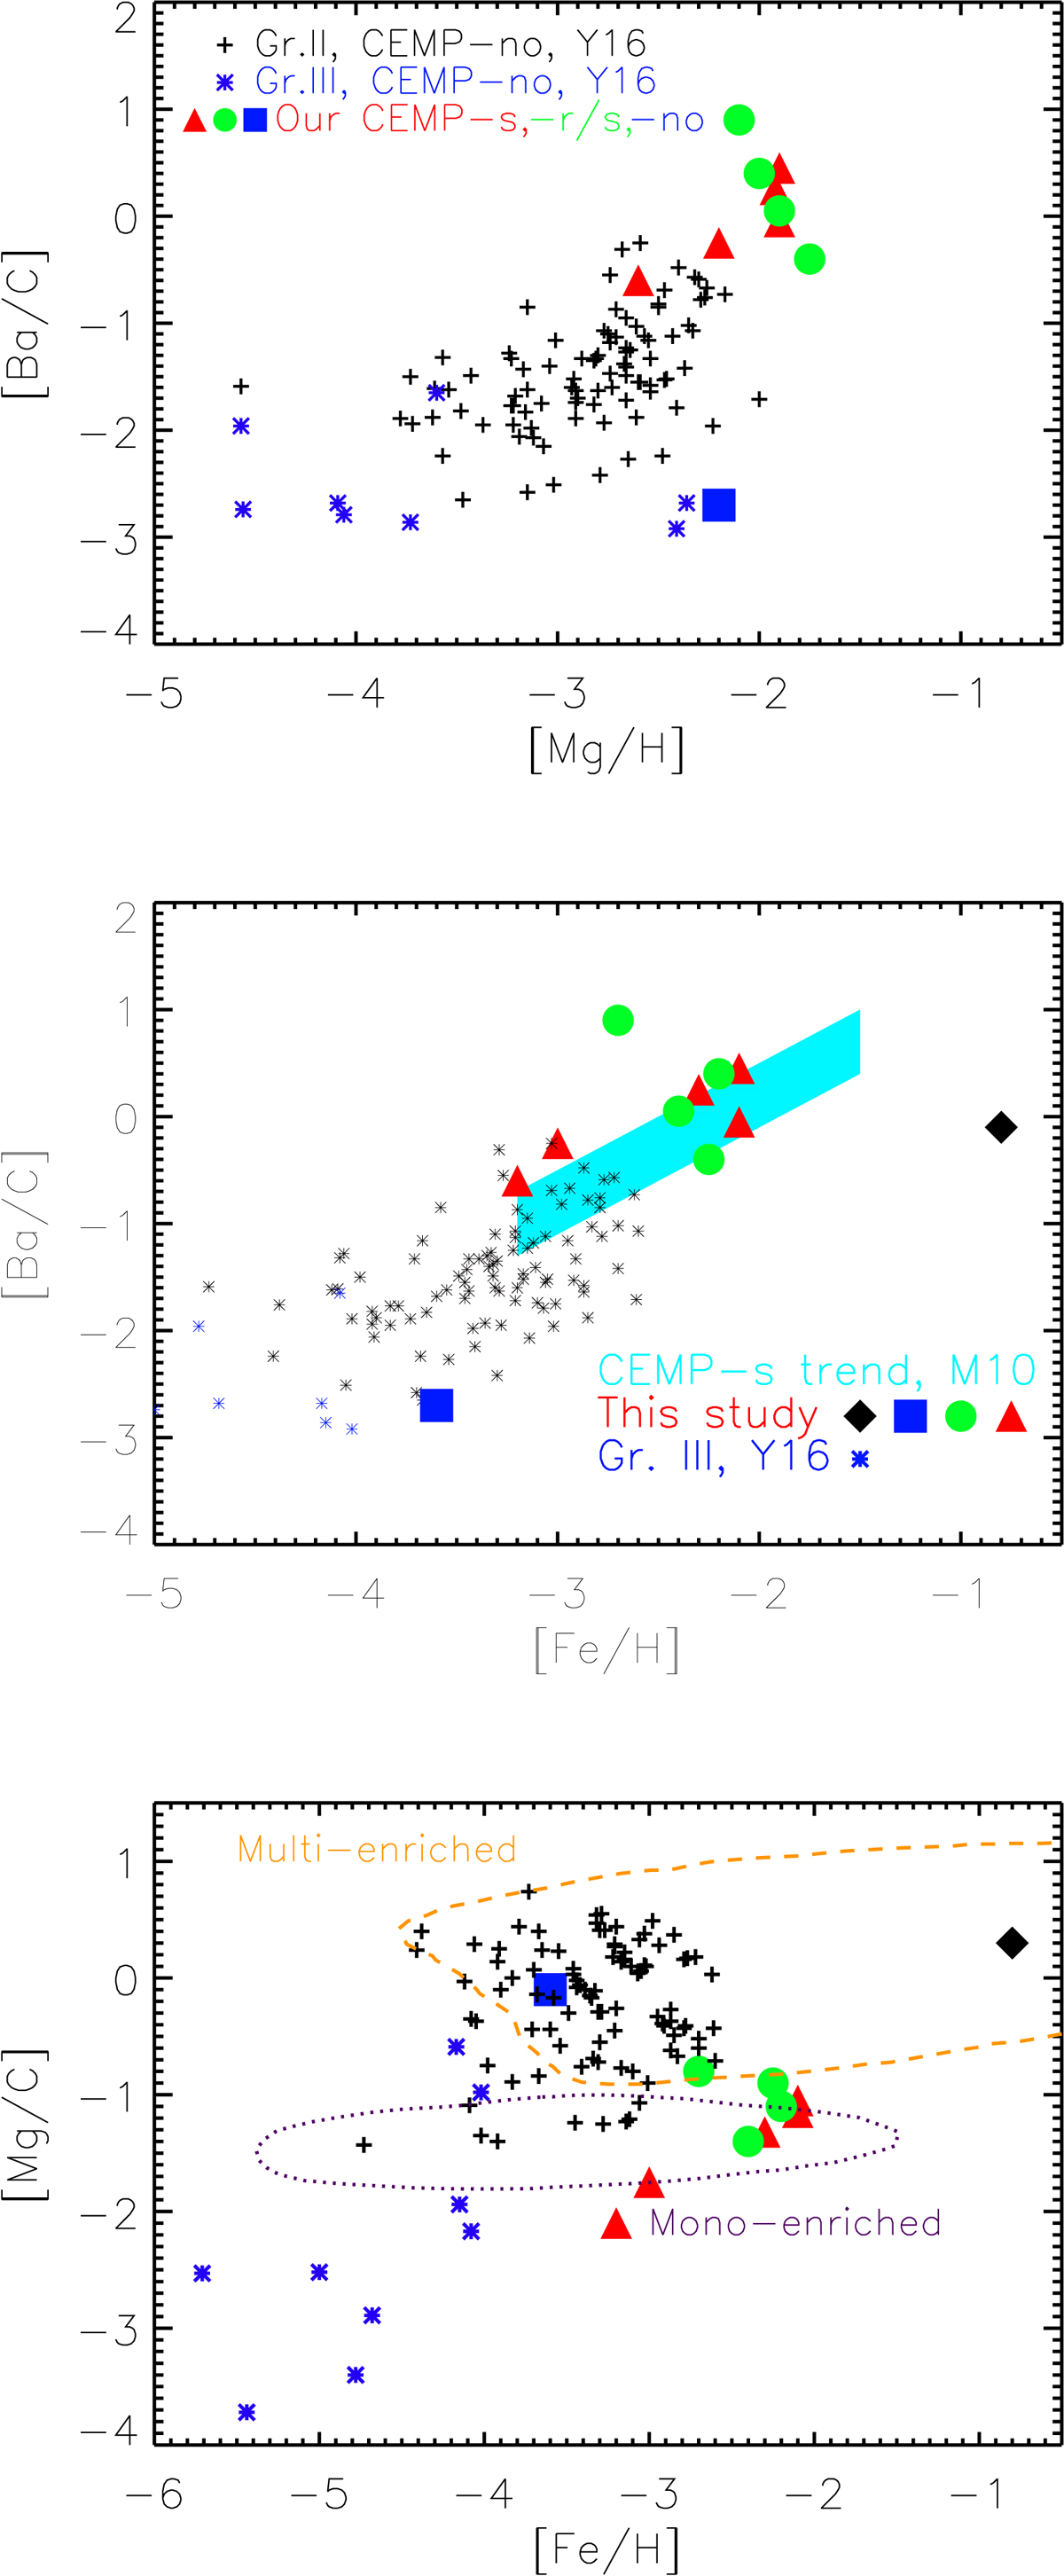
Top panel: ratio of [Ba/C] as a function of [Fe/H] and [Mg/H], for our programme data compared to literature studies (Yoon et al. 2016, Y16). The middle panel shows that our CEMP-s and CEMP-r/s stars both fall in the CEMP-s region proposed by Masseron et al. (2010, M10). Bottom panel: two different enrichment regions in a [Mg/C] vs. [Fe/H] diagnostics figure. In all panels we show our CEMP-no stars as filled blue squares, CEMP-s stars as filled red triangles, CEMP-r/s as green circles, and C-normal metal-poor stars as filled black diamonds.
Current usage metrics show cumulative count of Article Views (full-text article views including HTML views, PDF and ePub downloads, according to the available data) and Abstracts Views on Vision4Press platform.
Data correspond to usage on the plateform after 2015. The current usage metrics is available 48-96 hours after online publication and is updated daily on week days.
Initial download of the metrics may take a while.