Fig. 4
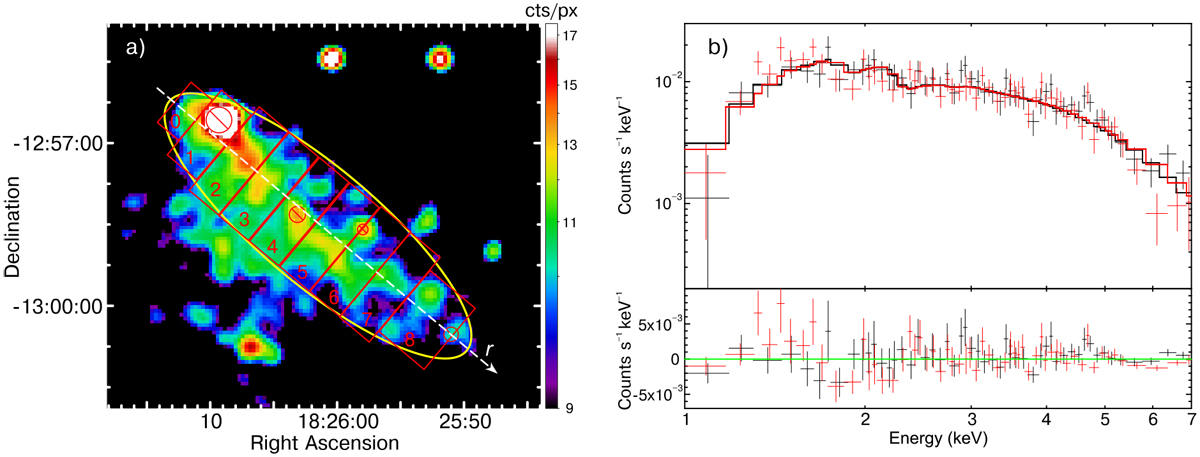
Panel a: regions used for the spatially resolved spectral analysis. Red circles are likely point sources excluded from the extraction regions. The circle inside box 1 was used to exclude the emission of the pulsar from the surrounding diffuse emission. Panel b: MOS1 (black) and MOS2 (red) spectra of the bar in the 1–7 keV band. The solid lines represent the best fit for an absorbed power-law model.
Current usage metrics show cumulative count of Article Views (full-text article views including HTML views, PDF and ePub downloads, according to the available data) and Abstracts Views on Vision4Press platform.
Data correspond to usage on the plateform after 2015. The current usage metrics is available 48-96 hours after online publication and is updated daily on week days.
Initial download of the metrics may take a while.