Fig. 3
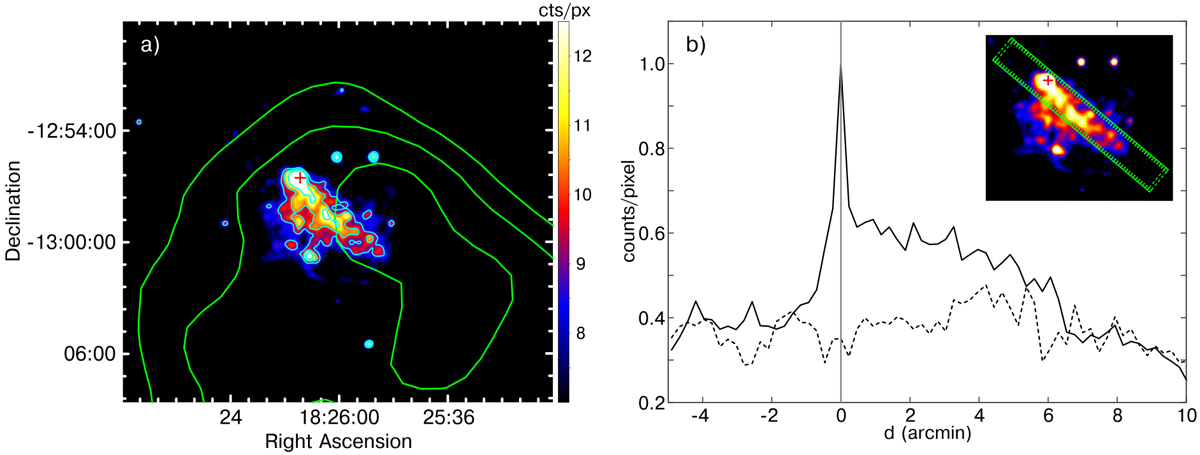
Panel a: X-ray emission towards PSR J1826−1256 in the 1–7 keV energy band. Cyan contours correspond to 9.5, 10.5, and 12.0 counts pixel−1. The position of the pulsar is indicated with a plus sign. Green contours trace the TeV emission from HESS J1826−130 at levels of (1.5, 1.8, and 2.1) × 10−13 ph cm−2 s−1. Panel b: a brightness profile along the PWN (solid line) and the adjacent background (dashed line). The rectangular box in the inset image indicates the regions from which the radial profile was extracted.
Current usage metrics show cumulative count of Article Views (full-text article views including HTML views, PDF and ePub downloads, according to the available data) and Abstracts Views on Vision4Press platform.
Data correspond to usage on the plateform after 2015. The current usage metrics is available 48-96 hours after online publication and is updated daily on week days.
Initial download of the metrics may take a while.