Fig. 1
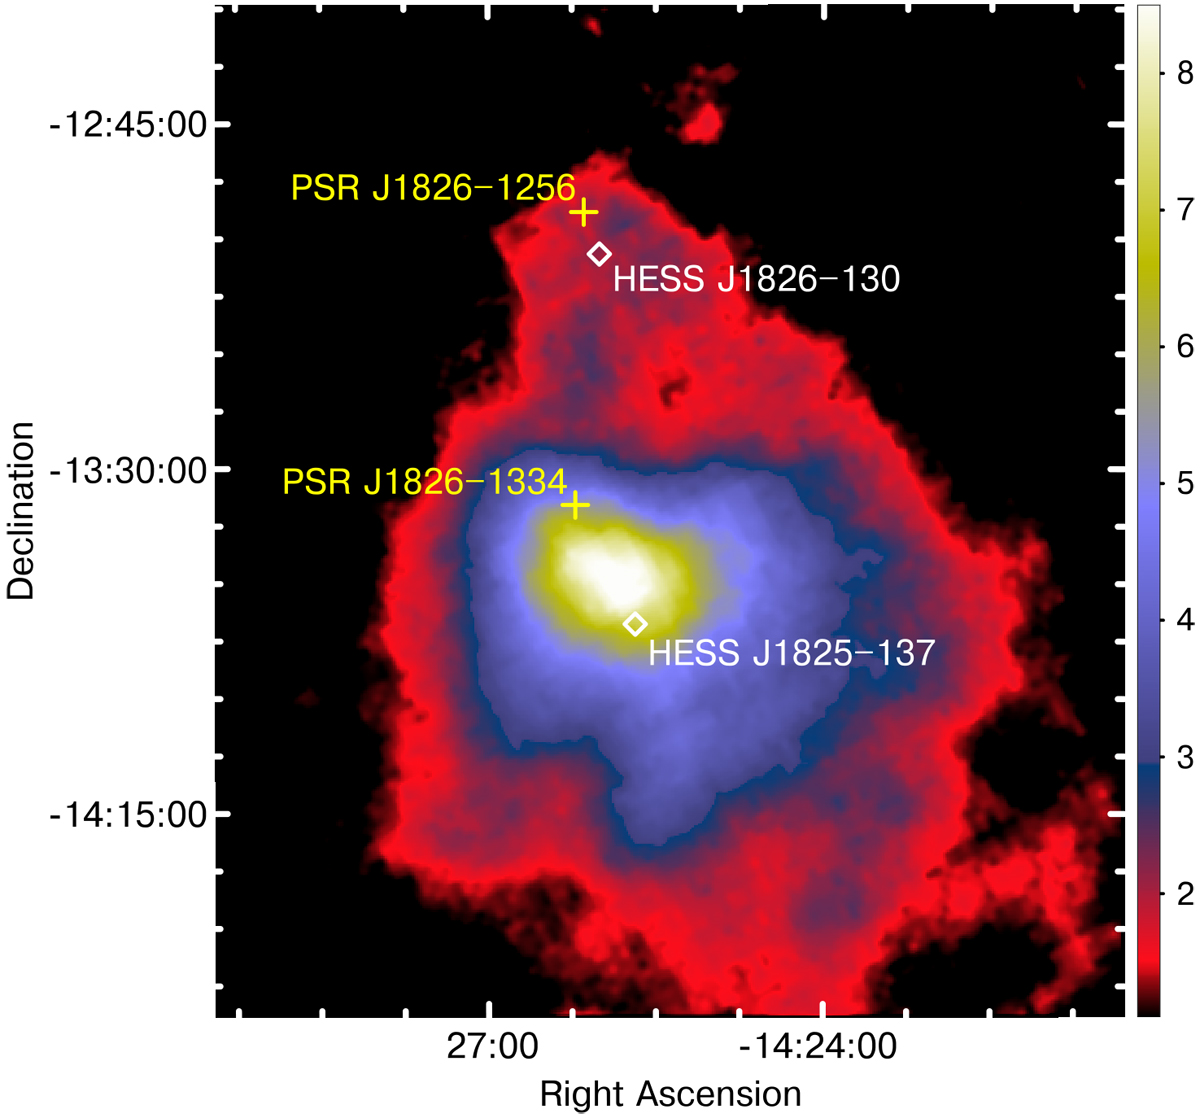
HESS J1825−137 and HESS J1826−130 γ-ray excess map (E > 0.2 TeV) extracted from the on-line material of the HGPS (H.E.S.S. Collaboration 2018).1 The wedge shows in units of 10−13 ph cm−2 s−1 the TeV flux.The plus signs indicate the position of the pulsars PSR J1826−1334 and PSR J1826−1256, and the diamonds the best-fit position of the TeV sources.
Current usage metrics show cumulative count of Article Views (full-text article views including HTML views, PDF and ePub downloads, according to the available data) and Abstracts Views on Vision4Press platform.
Data correspond to usage on the plateform after 2015. The current usage metrics is available 48-96 hours after online publication and is updated daily on week days.
Initial download of the metrics may take a while.