Fig. 1.
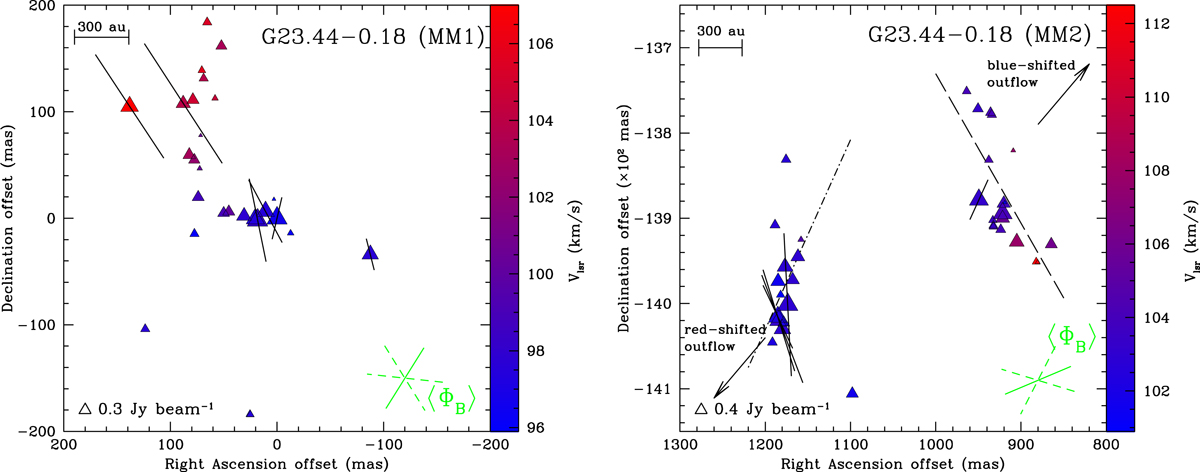
View of the CH3OH maser features detected around G23.44−0.18 MM1 (left panel) and MM2 (right panel). The reference position is the estimated absolute position from Table 1. Triangles identify CH3OH maser features whose side length is scaled logarithmically according to their peak flux density (Table A.1). Maser local standard of rest radial velocities are indicated by color (the assumed velocity of the region is ![]() , Bronfman et al. 1996). 0.3 Jy beam−1 and 0.4 Jy beam−1 symbols are plotted for comparison. The linear polarization vectors, scaled logarithmically according to the polarization fraction Pl (
, Bronfman et al. 1996). 0.3 Jy beam−1 and 0.4 Jy beam−1 symbols are plotted for comparison. The linear polarization vectors, scaled logarithmically according to the polarization fraction Pl (![]() and
and ![]() ; see Table A.1), are overplotted. In the bottom right corner the corresponding error-weighted orientation of the magnetic field (⟨ΦB⟩, see Sect. 5.1) is also shown, the two dashed segments indicate the uncertainty. The two arrows in the right panel indicate the direction, but not the actual position, of the red- and blue-shifted lobes of the 12CO(2−1) outflow associated with G23.44−0.18 (MM2) (
; see Table A.1), are overplotted. In the bottom right corner the corresponding error-weighted orientation of the magnetic field (⟨ΦB⟩, see Sect. 5.1) is also shown, the two dashed segments indicate the uncertainty. The two arrows in the right panel indicate the direction, but not the actual position, of the red- and blue-shifted lobes of the 12CO(2−1) outflow associated with G23.44−0.18 (MM2) (![]() ; Ren et al. 2011). The dashed and dash-dotted lines are the best least-squares linear fit of the western (
; Ren et al. 2011). The dashed and dash-dotted lines are the best least-squares linear fit of the western (![]() ) and eastern (
) and eastern (![]() ) groups of CH3OH maser features in G23.44+0.18 (MM2).
) groups of CH3OH maser features in G23.44+0.18 (MM2).
Current usage metrics show cumulative count of Article Views (full-text article views including HTML views, PDF and ePub downloads, according to the available data) and Abstracts Views on Vision4Press platform.
Data correspond to usage on the plateform after 2015. The current usage metrics is available 48-96 hours after online publication and is updated daily on week days.
Initial download of the metrics may take a while.