Fig. A.1.
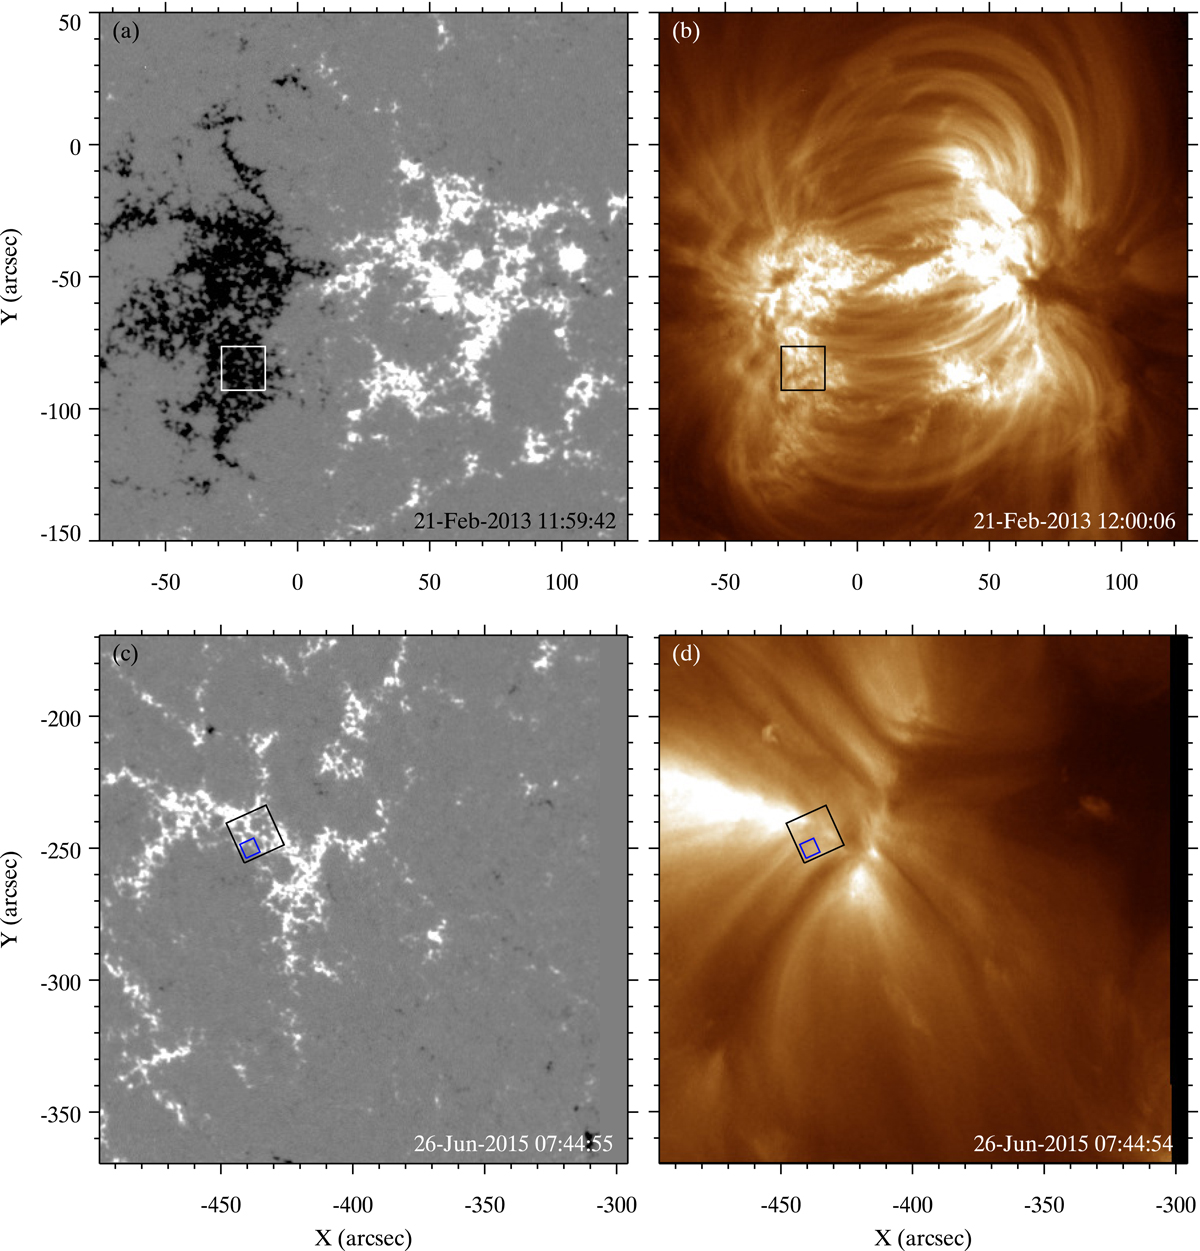
Context maps showing the photospheric and coronal diagnostics of plage areas in active regions. Panel a: photospheric line-of-sight magnetic field map of an evolved active region obtained from SDO/HMI. The white and black shaded areas are the positive- and negative-polarity magnetic field regions, saturated at ±300 G. The white box covers a patch of the active region with a predominantly negative-polarity magnetic field in an area of 16.5″ × 16.5″. Panel b: map of coronal emission of the active region recorded by the SDO/AIA 193 Å filter. The black box, which is cospatial with the white box in panel (a), identifies a coronal low-lying moss emission in this active region. Panels c and d: are the same as panels (a) and (b), but plotted for a decaying active region (weaker than the above). The black boxes have the same size as in the top panels and cover a predominantly positive-polarity magnetic field patch in this active region. Bottom panels: black box is the target region of the SST co-observations. The smaller blue box corresponds to region 3 in Fig. 1. See Sect. 2 for details.
Current usage metrics show cumulative count of Article Views (full-text article views including HTML views, PDF and ePub downloads, according to the available data) and Abstracts Views on Vision4Press platform.
Data correspond to usage on the plateform after 2015. The current usage metrics is available 48-96 hours after online publication and is updated daily on week days.
Initial download of the metrics may take a while.