Fig. 5.
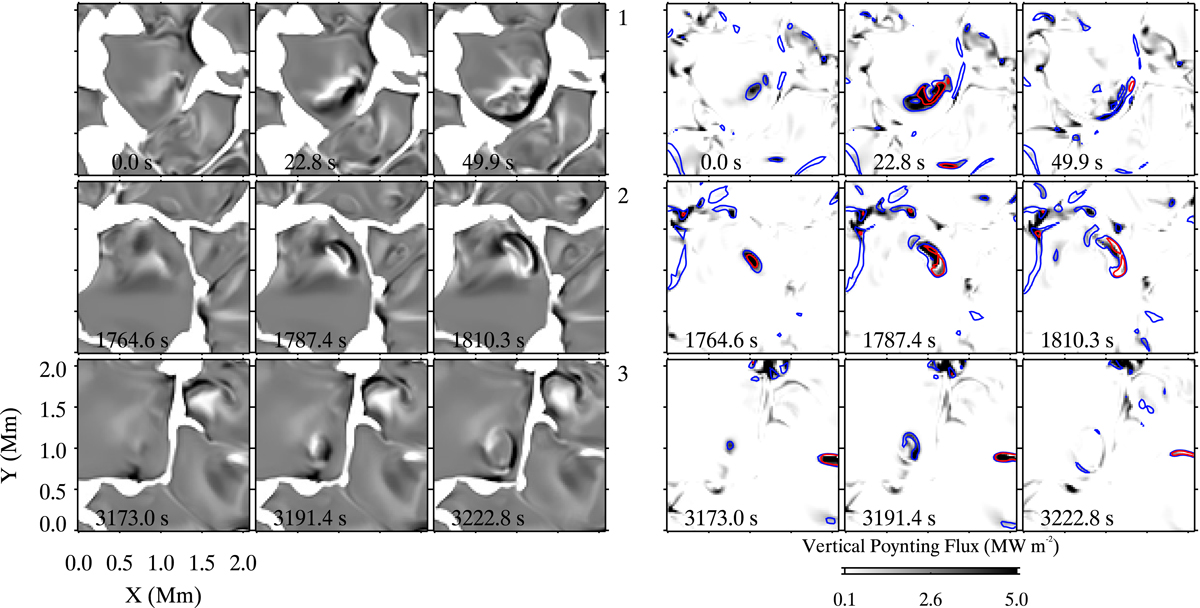
Simulated magnetic transients. Left panels: events of transient flux emergence in a plage simulation. Each row (numbered 1–3) tracks the evolution of flux emergence in granules from the respective areas marked in Fig. 4. The vertical component of the magnetic field is saturated at ±300 G. Right panels: display the spatial association of the photospheric horizontal magnetic field and the vertical component of the Poynting flux. These snapshots correspond to those displayed in the left panels. Shown in grayscale is the vertical component of the Poynting flux. The blue and red contours outline regions with a horizontal magnetic strength of 400 G and 600 G, respectively. These snapshots roughly correspond to the average τ500 = 1 surface. See Sect. 3 for details.
Current usage metrics show cumulative count of Article Views (full-text article views including HTML views, PDF and ePub downloads, according to the available data) and Abstracts Views on Vision4Press platform.
Data correspond to usage on the plateform after 2015. The current usage metrics is available 48-96 hours after online publication and is updated daily on week days.
Initial download of the metrics may take a while.