Fig. 3.
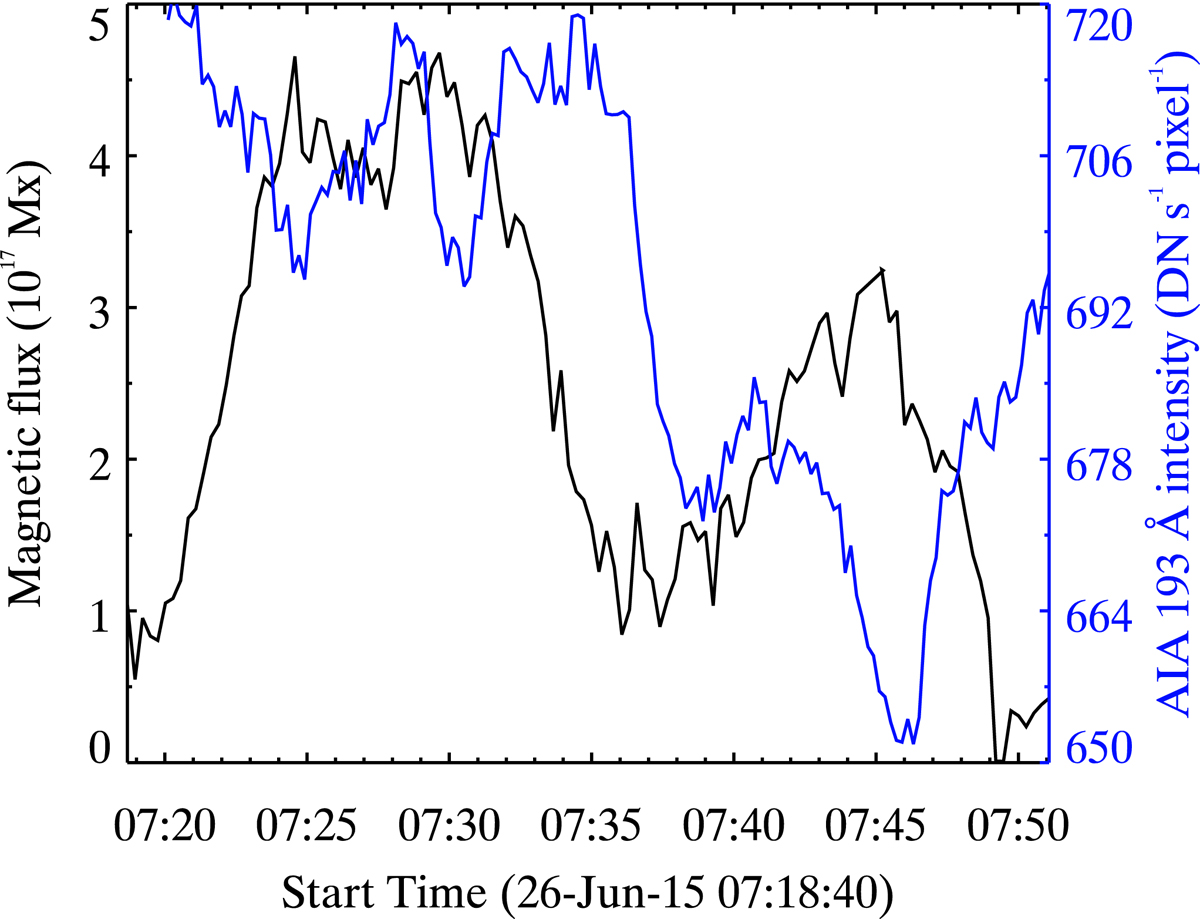
Signatures of a magnetic transient in the photosphere and the corona. The black curve shows the photospheric magnetic flux integrated over the area that is covered by the minor negative-polarity features as a function of time from region 3 in Fig. 1a from SST observations (see also Fig. 2). To avoid noise, only pixels with a magnetic flux density above 10 G are considered for the integration. The blue curve shows the coronal EUV emission recorded by the AIA 193 Å channel from the blue box in Fig. A.1d overlying SST region 3. See Sect. 2 for details.
Current usage metrics show cumulative count of Article Views (full-text article views including HTML views, PDF and ePub downloads, according to the available data) and Abstracts Views on Vision4Press platform.
Data correspond to usage on the plateform after 2015. The current usage metrics is available 48-96 hours after online publication and is updated daily on week days.
Initial download of the metrics may take a while.