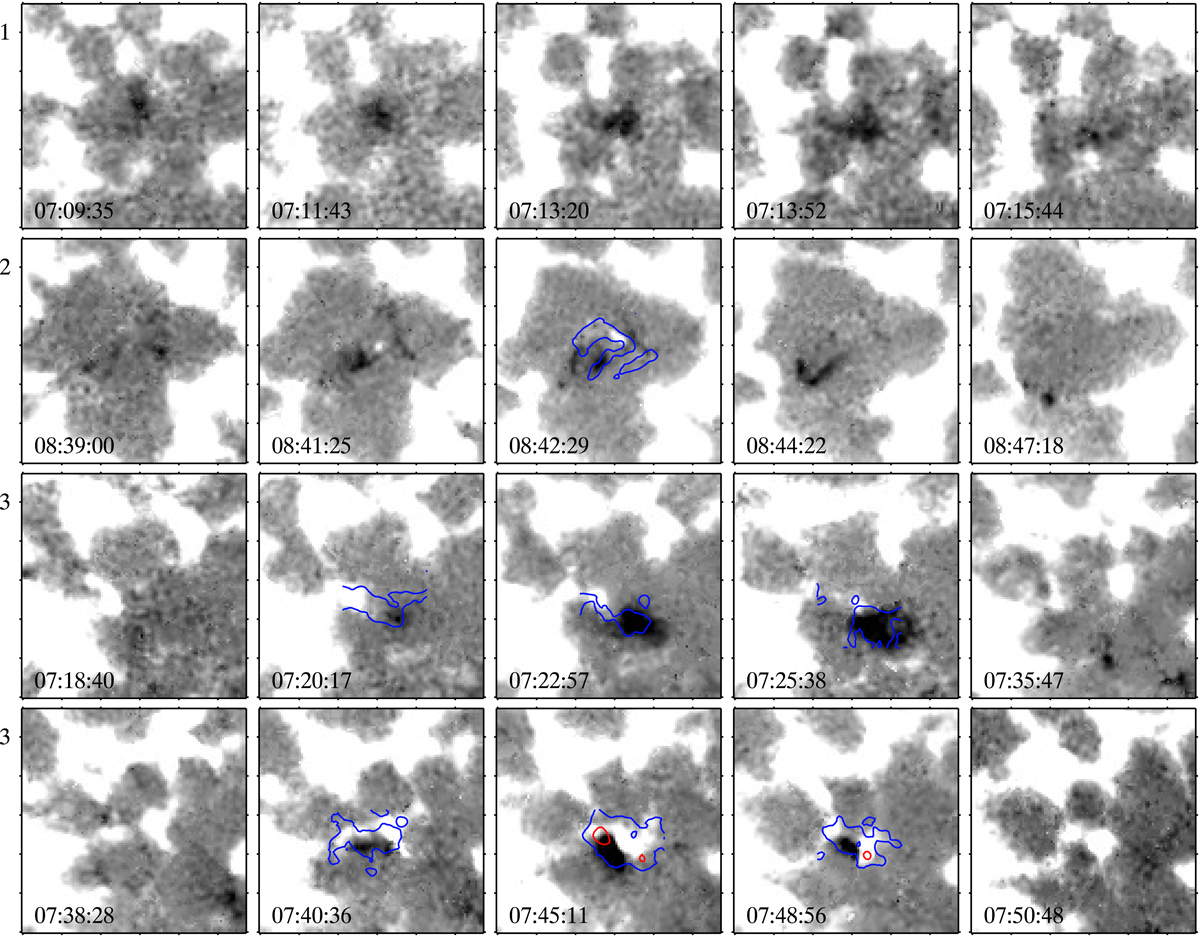
Fig. 2.

Evolution of the magnetic transients in a plage region. The region covered by the panels in each row shows the SST line-of-sight magnetic field map (saturated at ±50 G) and is marked with the respective numbered box in Fig. 1a. The rows display sequences of transient flux emergence and cancellation. The contours are for the horizontal component of the magnetic field (blue: 150 G; red: 300 G; the contours are restricted to a small rectangular patch that covers the transient). The bottom two rows show region 3 in Fig. 1. The left-most column corresponds to the state prior to the emergence of transients (except for region 1, where the emergence had already begun at the start of SST observations). The right-most column shows the state after the cancellation of transient events. See Sect. 2 for details.
Current usage metrics show cumulative count of Article Views (full-text article views including HTML views, PDF and ePub downloads, according to the available data) and Abstracts Views on Vision4Press platform.
Data correspond to usage on the plateform after 2015. The current usage metrics is available 48-96 hours after online publication and is updated daily on week days.
Initial download of the metrics may take a while.


