Fig. 1.
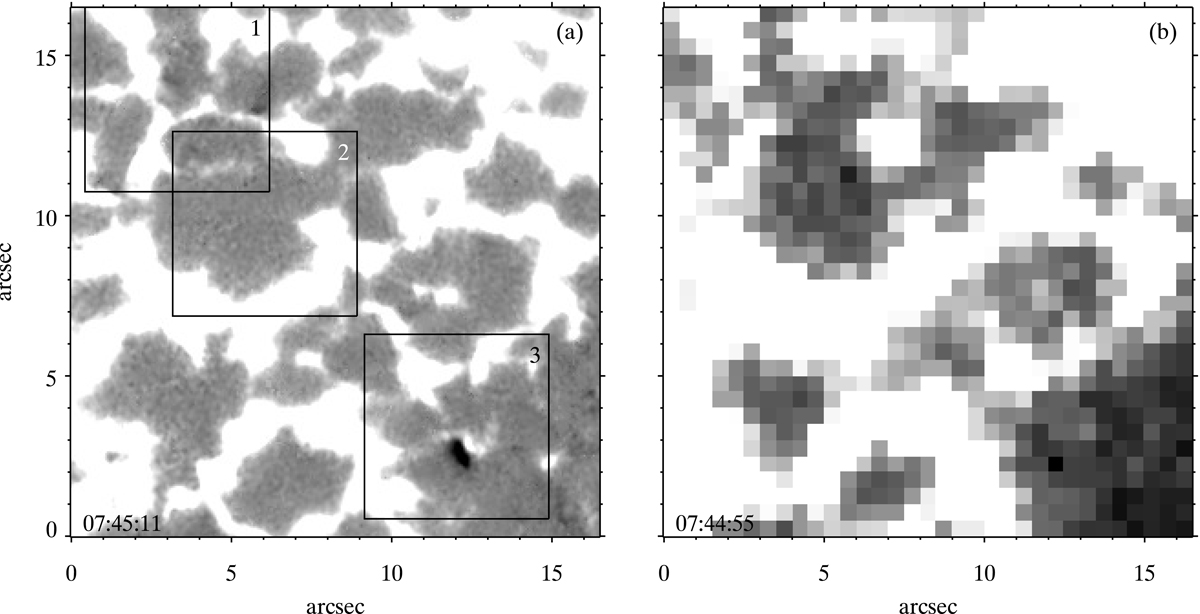
Observations of the magnetic transients in a plage region. Details of the photospheric magnetic field in a decaying active region outlined by the black box in Fig. A.1c are shown. Panel a: line-of-sight magnetic field map obtained from SST observations on 26 June 2015 07:45 UT. The three boxes (numbered 1–3; each covering an area of 5.76″ × 5.76″) enclose regions exhibiting transient magnetic flux emergence and cancellation at different instances during the evolution of a predominantly positive-polarity magnetic field patch in that active region (box 3 highlights one such transient). Panel b: line-of-sight magnetic field map obtained from the SDO/HMI displayed for comparison. Both maps are saturated at ±100 G. See Sect. 2 for details.
Current usage metrics show cumulative count of Article Views (full-text article views including HTML views, PDF and ePub downloads, according to the available data) and Abstracts Views on Vision4Press platform.
Data correspond to usage on the plateform after 2015. The current usage metrics is available 48-96 hours after online publication and is updated daily on week days.
Initial download of the metrics may take a while.